. 2025 Aug;14(15):e71060.
doi: 10.1002/cam4.71060.

CXCL16 Producing Tumor Clones Are Shaping Immunosuppressive Microenvironment in Squamous Cell Carcinoma via CXCR6 Regulatory T Cell

Affiliations

CXCL16 Producing Tumor Clones Are Shaping Immunosuppressive Microenvironment in Squamous Cell Carcinoma via CXCR6 Regulatory T Cell

Hyun Seung Choi et al. Cancer Med. 2025 Aug.

Abstract

Background: Cutaneous squamous cell carcinoma (cSCC) and basal cell carcinoma (BCC) are the most prevalent types of nonmelanoma skin cancer (NMSC) and exhibit significant inter- and intra-tumor heterogeneity. cSCC has a higher metastatic potential than BCC, accompanied by a considerable mortality rate. However, the detailed mechanisms of tumor evolution in cSCC have not yet been described.

Methods: We performed single-cell RNA sequencing (scRNA-seq) and T cell receptor (TCR) clonal analysis of skin biopsies from five BCCs, three squamous cell carcinomas in situ (SCCIS), and two invasive squamous cell carcinomas (SCC). Independent SCC specimens were used for spatial transcriptomic (ST) analysis using GeoMx Digital Spatial Profiler (DSP).

Result: Using scRNA-seq, we analyzed a total of 117,663 cells. We distinguished cancer cells using copy number variation and identified SCC-specific genes that potentially contribute to tumor progression. Analysis of tumor clones revealed SCC-specific COL6A1+/ITGA5+ carcinoma cells which produce CXCL16. We also annotated CXCR6+ regulatory T cells (Tregs) which potentially move toward the tumor site by CXCL16, shaping the immunosuppressive TME. ST analysis supported these clones were located at the invasion site of SCC.

Conclusion: We suggest COL6A1 and ITGA5 promote the invasive and metastatic property of SCC. We also uncovered how SCC recruits Tregs via the CXCL16/CXCR6 axis to create a TME favorable for its survival. These molecules can be used as potential therapeutic targets for treatment of SCC.

Keywords: basal cell carcinoma; cutaneous squamous cell carcinoma; scRNA and TCR seq; spatial transcriptomic.


Conflict of interest statement

Integration analysis of scRNA‐seq and ST of NMSC reveals mechanisms by which specific SCC clusters promote metastasis and shape an immunosuppressive TME, providing new approaches for targeted therapies to prevent SCC progression.

The authors declare no conflicts of interest.

Figures
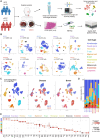
FIGURE 1
FIGURE 1
Cellular characterization SCC skin biopsy using scRNA‐seq. (A) Schematic representation of isolation and processing workflow from BCC and SCC tissue. (B) UMAP plot of skin samples from BCC biopsies (n = 5) and SCC biopsies (n = 5). IDs represent cancer type and donor. Eleven distinct meta‐clusters are defined on the right and color‐coded accordingly per cell type. (C) Clustering of integrated BCC and SCC datasets is grouped by meta‐clusters, diseases, and donor using scVI‐integration. Meta‐clusters, diseases, and donor are labeled and color‐coded. (D) Proportion of cell types grouped by donor. (E) Dot plot of top five marker genes identified by differential gene expression among cell types. White, low average gene expression; dark red, high average gene expression. Size of circle represents the percentage of cells expressing gene markers of interest.
FIGURE 2
FIGURE 2
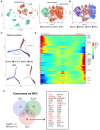
Analysis of SCC properties and cellular evolutionary trajectory. (A) The Copycat software identifies the malignant epithelial cells; aneuploidy: malignant; diploid: normal. The cells marked with circles are keratinocytes, while the aneuploid cells are labeled as carcinoma. (B) Clustering of normal and malignant epithelial cells grouped by diseases. (C) Upper, trajectory plot of keratinocyte. Arrows indicate the differentiation pathway and directions from normal keratinocyte to two cell fates; red: cell fate 1; blue: cell fate 2. Bottom, cells along the trajectory divided into two groups based on BCC and SCC samples. Diseases are labeled and color‐coded. (D) Heatmap depicting the key genes involved in branch determination and their functions. Heatmap showing the two dynamic gene expression patterns between two cell fates. In each cell fate, genes related to pathogenesis are indicated with larger font size. (E) Venn diagram of disease‐specific DEGs (versus normal keratinocyte, log2 fold‐change > 2, minimum fraction of cells > 0.3). The genes highlighted in red are associated with SCC growth and progression.
FIGURE 3
FIGURE 3
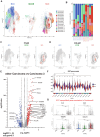
Characteristics of SCC‐specific carcinoma subpopulations. (A) UMAP for carcinoma cells grouped by sub‐clusters. Fourteen carcinoma cells were identified. Cells are color‐coded accordingly. (B) Proportion of cell types grouped by donor. (C, D) Feature plots of expression distribution for ITGA5 (C), and COL6A1 (D), among diseases. (E) Volcano plot of differentially expressed genes between carcinoma clusters and carcinoma 3. Log2 fold‐change is shown on the x‐axis and –log10 p values are shown on the y‐axis. A total of 353 genes were found to be increased in carcinoma 3 compared to other carcinomas. (F) Violin plots of the hallmark EMT gene signature score in Carcinoma subpopulations between SCC and other tumor. Carcinoma 3 in SCC exhibited the highest expression of Hallmark EMT gene signature (G) Violin plots showing SCC upregulated genes in carcinoma 3 grouped by diseases. The genes involved in attracting and interacting with immune cells were found to be increased. p < 0.05 suggested significant differences. ∗p < 0.05, ∗∗p < 0.01, ∗∗∗p < 0.001, ∗∗∗∗p < 0.0001 and ns, not significant.
FIGURE 4
FIGURE 4
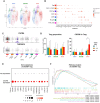
CXCR6 expressing Treg migrate to tumor site and exert immunosuppressive functions. (A) UMAP showing the distribution of T cell subsets. (B) Dot plot showing the highly expressed marker genes in each immune cell type. The dot color represents the average expression level of the marker genes in each cell type and the dot size represents the percentage of cells expressing the marker genes in each cell type. (C) Violin plots of expression distribution for TNFRSF9 and CXCR6 among diseases. Two genes were highlighted in Treg clusters where both genes were expressed. (D) Bar plot showing Treg proportion in T cells and CXCR6 expression in Treg grouped by disease and clonal size. In the analysis employing 2‐way ANOVA, an increase in the proportion of CXCR6 expression was observed in SCC during clonal expansion (* = 0.287). (E) Dot plot showing the expression levels of immunosuppressive gene signature genes in Treg grouped by CXCR6 expression levels. Treg expressing CXCR6 showed an increased immunosuppressive function. (F) Gene set enrichment analysis (GSEA) comparing CXCR6+ versus CXCR6‐ Tregs revealed enrichment of multiple immunologically relevant gene sets. Each line represents the running enrichment score across the ranked gene list for each gene set. The colored tick marks below indicate the positions of genes from each signature within the ranked list. Associated normalized enrichment score (NES), p values and adjusted p values are shown in the table.
FIGURE 5
FIGURE 5
Cellular crosstalk between carcinoma 3 and Treg. (A) Left, heatmap of average log2 fold‐change across carcinoma among diseases of NicheNet top predicted ligands expressed by carcinoma 3. Bottom, heatmap of average log2 fold‐change of ligand‐matched receptors expressed by T cell subtype. Middle, heatmap of predicted ligand‐receptor interaction potential between carcinoma 3 and Treg. SCC‐specific interactions are indicated by red boxes. (B, C) Violin plot showing predicted SCC ligands in carcinoma 3 (B) and ligand‐matched receptors (C) grouped by diseases. Ligands that activate Treg specifically increased in SCC. (D) Left, heatmap of average log2 fold‐change across T cell subtypes of NicheNet top predicted ligands expressed by Treg. Bottom, heatmap of average log2 fold‐change of ligand‐matched receptor expressed in carcinoma 3 grouped by diseases. Middle, heatmap of predicted ligand‐receptor interaction potential between Treg and carcinoma 3. SCC‐specific interactions are indicated by red boxes. (E) Violin plot showing predicted ligands in Treg grouped by diseases. Ligands that promote cancer proliferation and metastasis specifically increased in SCC.
FIGURE 6
FIGURE 6
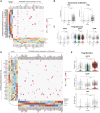
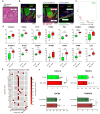
Digital spatial profiling reveals transcriptional programs and tumor–immune interactions in SCC. (A) Example of a representative SCC sample stained with H&E. Inset shows a higher magnification of a selected ROI. (B) Representative GeoMx spatial transcriptomics images from squamous cell carcinoma (SCC), and pemphigus vulgaris (PV) skin lesions. In SCC samples (n = 2), regions of interest (ROIs) were selected to capture PanCK+ tumor areas in close proximity to immune cell infiltrates. ROIs were segmented into SCC_Tumor and SCC_TME based on PanCK expression. In PV and PSO lesions, epithelial and immune compartments were delineated using CD45/CD31 and PanCK markers. (C) UMAP plot displaying spatial transcriptomic profiles from SCC (n=8 tumor, n = 8 TME), and PV (n = 10 epithelial, n = 9 immune) regions. Each point represents an individual area of interest (AOI), color‐coded by lesion type and tissue compartment. (D) Boxplots illustrating genes associated with SCC progression and previously identified in the Carcinoma 3 cluster, the majority of which were significantly upregulated in SCC_Tumor compared to PV and PSO epithelial regions. (E) Heatmap showing paired Spearman correlation analysis of ligand–receptor gene pairs in SCC. Each row represents a ligand expressed in SCC_Tumor regions, and each column represents its corresponding receptor in SCC_TME regions. Ligand–receptor pairs were pre‐selected based on top‐ranked interactions predicted from Carcinoma 3 in Figure 5A, and only those with Spearman correlation coefficient ≥ 0 are shown. Cell color represents the strength of correlation, and values within each cell indicate the associated p value. The red‐highlighted ligand–receptor pairs were previously identified as key components of the Carcinoma 3—Treg interaction network. (F) Scatter plots showing the expression of selected ligands (CXCL16, TNFSF9) and their corresponding receptors (CXCR6, TNFRSF9) in SCC and PV samples. Ligands were measured in SCC_Tumor and PV epithelial regions, while receptors were measured in SCC_TME and PV immune regions. Among these, CXCL16 and TNFRSF9 showed significant upregulation in SCC samples. p < 0.05 suggested significant differences. ∗p < 0.05, ∗∗p < 0.01, ∗∗∗p < 0.001, ∗∗∗∗p < 0.0001 and ns, not significant.

Similar articles

References

    1. Geller A. C. and Annas G. D., “Epidemiology of Melanoma and Nonmelanoma Skin Cancer,” Seminars in Oncology Nursing 19, no. 1 (2003): 2–11, 10.1053/sonu.2003.50000. - DOI - PubMed
    1. Nehal K. S. and Bichakjian C. K., “Update on Keratinocyte Carcinomas,” New England Journal of Medicine 379, no. 4 (2018): 363–374, 10.1056/NEJMra1708701. - DOI - PubMed
    1. Chang M. S., Azin M., and Demehri S., “Cutaneous Squamous Cell Carcinoma: The Frontier of Cancer Immunoprevention,” Annual Review of Pathology 17 (2022): 101–119, 10.1146/annurev-pathol-042320-120056. - DOI - PubMed
    1. Cameron M. C., Lee E., Hibler B. P., et al., “Basal Cell Carcinoma: Epidemiology; Pathophysiology; Clinical and Histological Subtypes; and Disease Associations,” Journal of the American Academy of Dermatology 80, no. 2 (2019): 303–317, 10.1016/j.jaad.2018.03.060. - DOI - PubMed
    1. Winge M. C. G., Kellman L. N., Guo K., et al., “Advances in Cutaneous Squamous Cell Carcinoma, Nature Reviews,” Cancer 23, no. 7 (2023): 430–449, 10.1038/s41568-023-00583-5. - DOI - PubMed

MeSH terms