

Med-DGTN: Dynamic Graph Transformer with Adaptive Wavelet Fusion for multi-label medical image classification
- PMID: 40776911
- PMCID: PMC12328407
- DOI: 10.3389/fmed.2025.1600736
Med-DGTN: Dynamic Graph Transformer with Adaptive Wavelet Fusion for multi-label medical image classification
Abstract
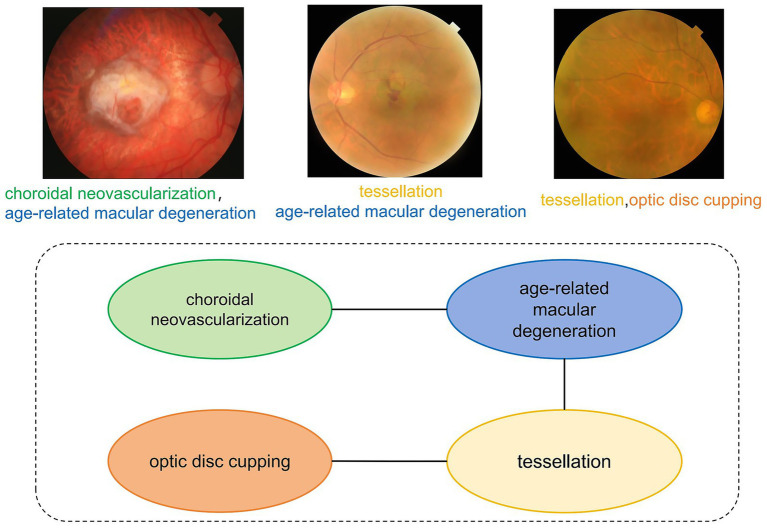
Introduction: Multi-label classification of medical imaging data aims to enable simultaneous identification and diagnosis of multiple diseases, delivering comprehensive clinical decision support for complex conditions. Current methodologies demonstrate limitations in capturing disease co-occurrence patterns and preserving subtle pathological signatures. To address these challenges, we propose Med-DGTN, a dynamically integrated framework designed to advance multi-label classification performance in clinical imaging analytics.
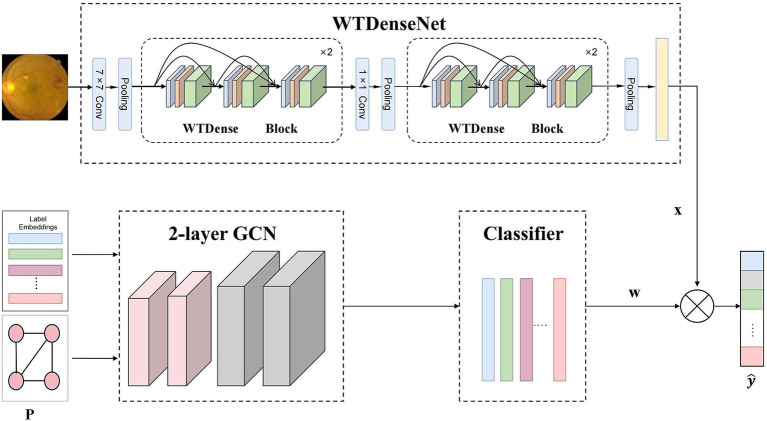
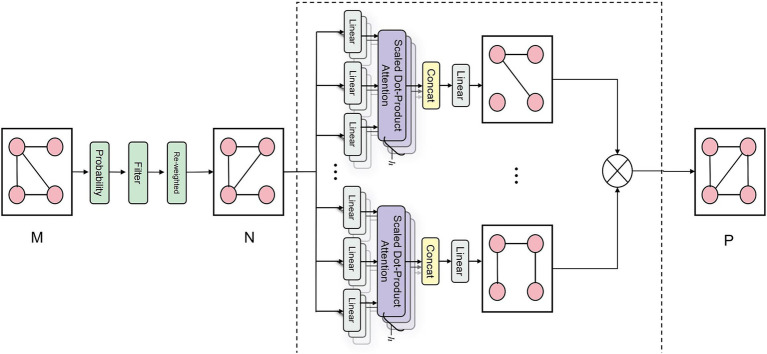
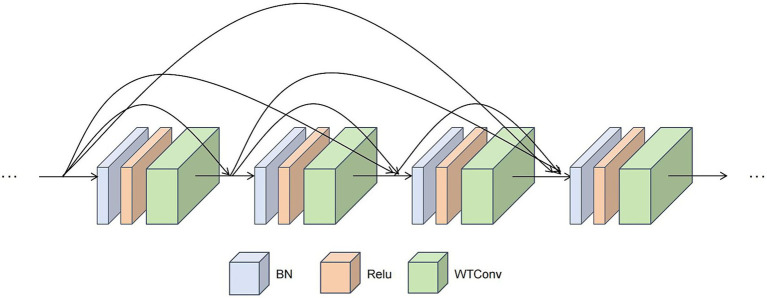
Methods: The proposed Med-DGTN (Dynamic Graph Transformer Network with Adaptive Wavelet Fusion) introduces three key innovations: (1) A cross-modal alignment mechanism integrating convolutional visual patterns with graph-based semantic dependencies through conditionally reweighted adjacency matrices; (2) Wavelet-transform-enhanced dense blocks (WTDense) employing multi-frequency decomposition to amplify low-frequency pathological biomarkers; (3) An adaptive fusion architecture optimizing multi-scale feature hierarchies across spatial and spectral domains.
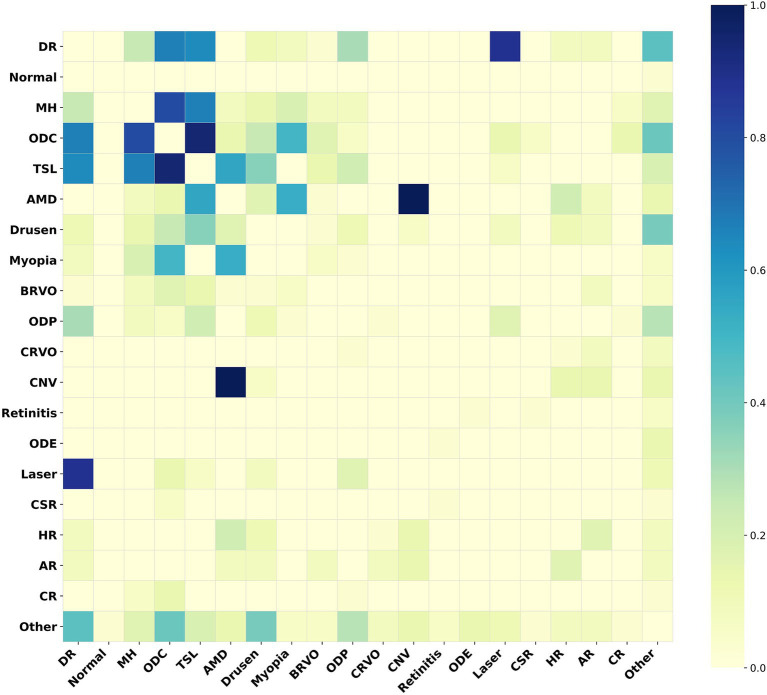
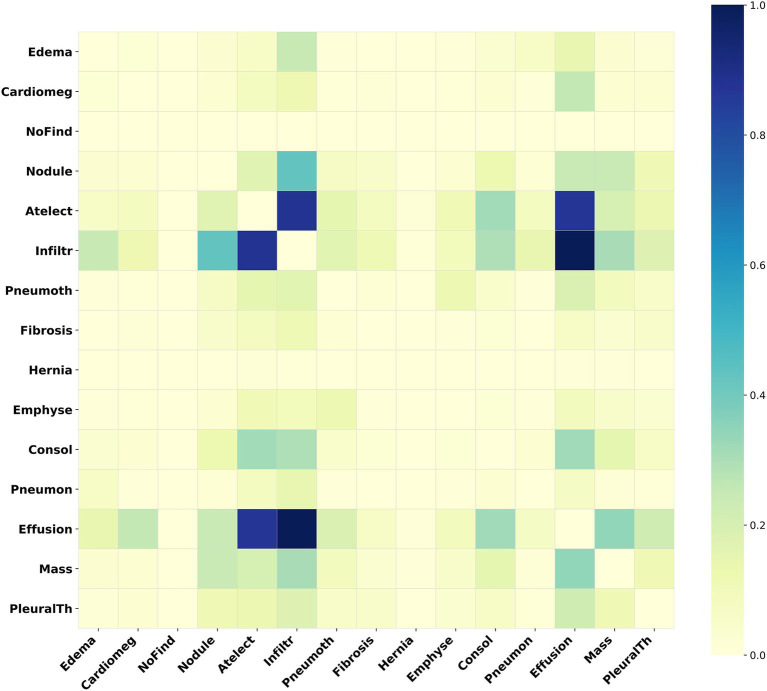
Results: Validated on two public medical imaging benchmarks, Med-DGTN demonstrates superior performance across modalities: (1) Achieving a mean average precision (mAP) of 70.65% on the retinal imaging dataset (MuReD2022), surpassing previous state-of-the-art methods by 2.68 percentage points. (2) On the chest X-ray dataset (ChestXray14), Med-DGTN achieves an average Area Under the Curve (AUC) of 0.841. It outperforms prior state-of-the-art methods in 5 of 14 disease categories.
Discussion: This investigation establishes that joint modeling of dynamic disease correlations and wavelet-optimized feature representation significantly enhances multi-label diagnostic capabilities. Med-DGTN's architecture demonstrates clinical translatability by revealing disease interaction patterns through interpretable graph structures, potentially informing precision diagnostics in multi-morbidity scenarios.
Keywords: Dynamic Graph Transformer; deep learning; medical image analysis; multi-label classification; wavelet transform.
Copyright © 2025 Zhang, Li, Wang, Shi, Jin and Gu.
Conflict of interest statement
The authors declare that the research was conducted in the absence of any commercial or financial relationships that could be construed as a potential conflict of interest.
Figures
Similar articles
-
Multi-level channel-spatial attention and light-weight scale-fusion network (MCSLF-Net): multi-level channel-spatial attention and light-weight scale-fusion transformer for 3D brain tumor segmentation.Quant Imaging Med Surg. 2025 Jul 1;15(7):6301-6325. doi: 10.21037/qims-2025-354. Epub 2025 Jun 30. Quant Imaging Med Surg. 2025. PMID: 40727355 Free PMC article.
-
ST-GTrans: Spatio-temporal graph transformer with road network semantic awareness for traffic flow prediction.Neural Netw. 2025 Oct;190:107623. doi: 10.1016/j.neunet.2025.107623. Epub 2025 May 28. Neural Netw. 2025. PMID: 40466347
-
Advanced glaucoma disease segmentation and classification with grey wolf optimized U -Net++ and capsule networks.Int Ophthalmol. 2025 Jun 27;45(1):266. doi: 10.1007/s10792-025-03602-6. Int Ophthalmol. 2025. PMID: 40576831
-
Sparse-view spectral CT reconstruction via a coupled subspace representation and score-based generative model.Quant Imaging Med Surg. 2025 Jun 6;15(6):5474-5495. doi: 10.21037/qims-24-2226. Epub 2025 May 28. Quant Imaging Med Surg. 2025. PMID: 40606332 Free PMC article.
-
Advancing respiratory disease diagnosis: A deep learning and vision transformer-based approach with a novel X-ray dataset.Comput Biol Med. 2025 Aug;194:110501. doi: 10.1016/j.compbiomed.2025.110501. Epub 2025 Jun 9. Comput Biol Med. 2025. PMID: 40494170
References
LinkOut - more resources
Full Text Sources