

Vitamin D3 affects liver expression of pro-/anti-inflammatory cytokines and nitric oxide synthases in type 2 diabetes
- PMID: 40776976
- PMCID: PMC12328252
- DOI: 10.3389/ebm.2025.10456
Vitamin D3 affects liver expression of pro-/anti-inflammatory cytokines and nitric oxide synthases in type 2 diabetes
Abstract
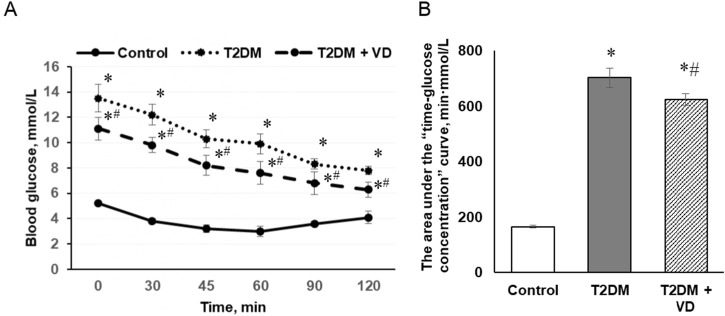
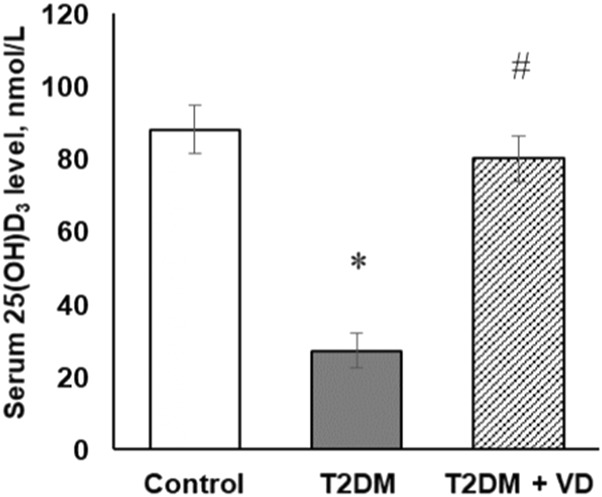
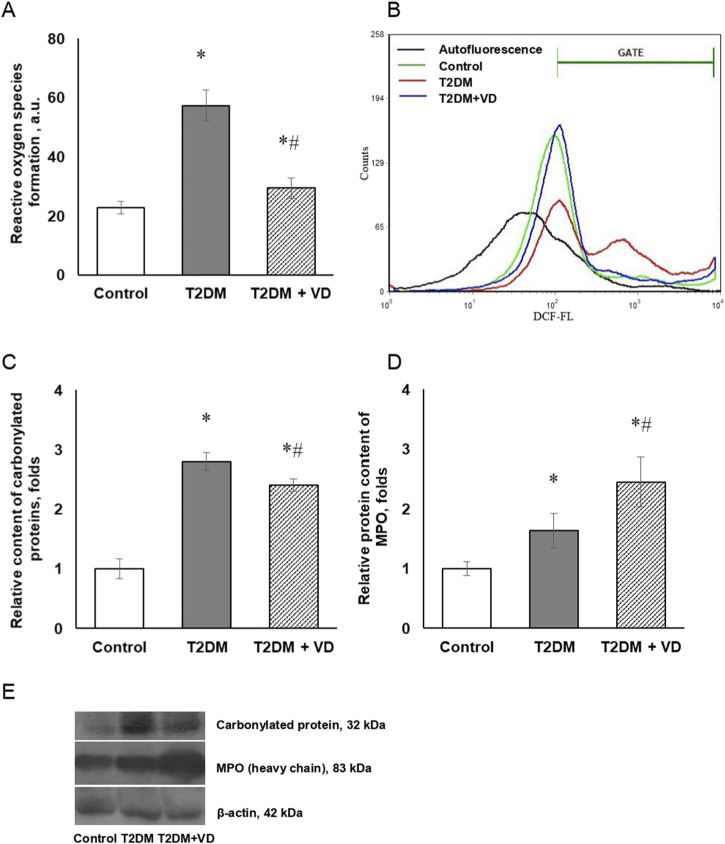
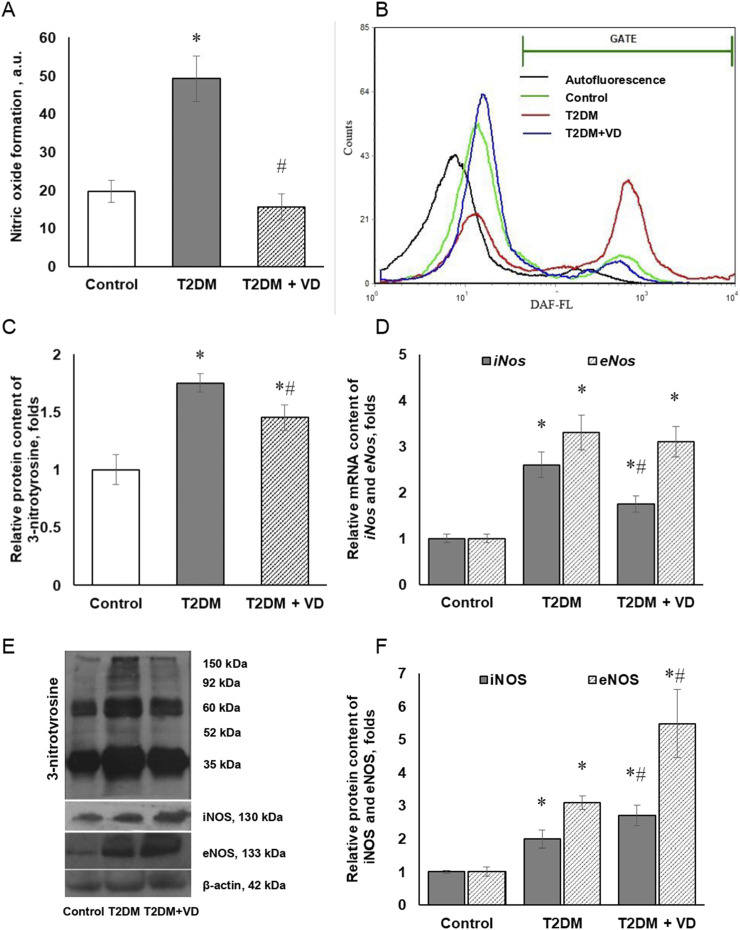
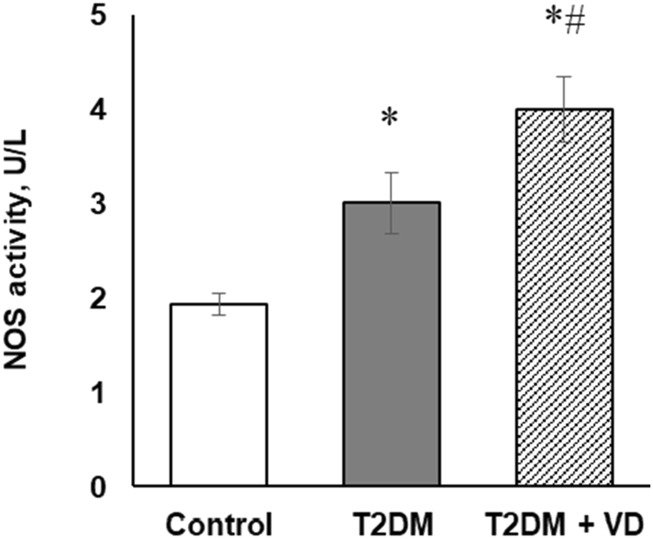
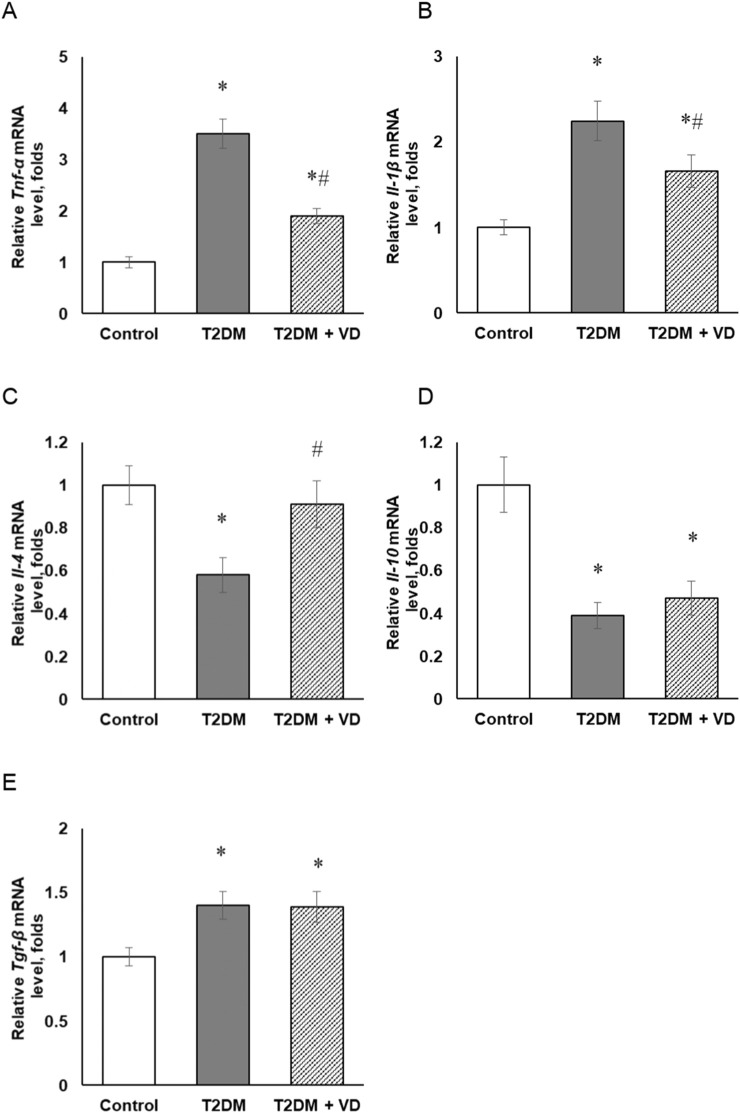
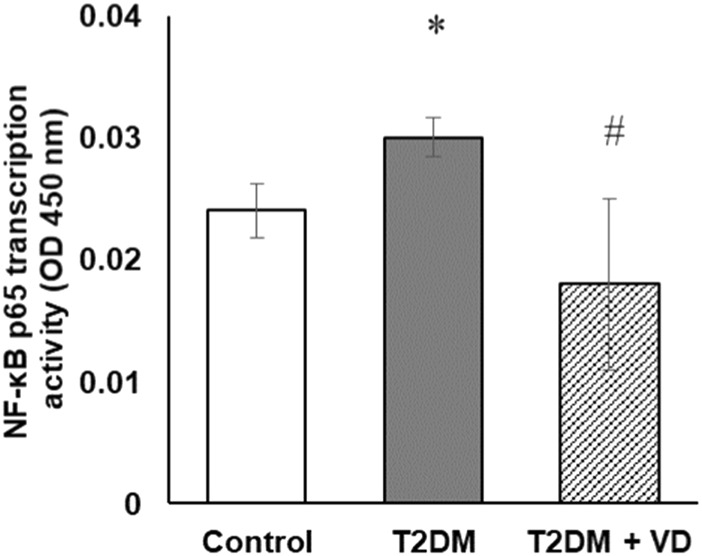
Our objective was to study the effect of vitamin D3 (VD) on hepatocellular oxidative-nitrosative stress and pro/anti-inflammatory cytokines in relation to nitric oxide (NO) formation and NO synthase (NOS) levels in type 2 diabetes mellitus (T2DM). After T2DM induction by high-fat diet and a single streptozotocin injection (25 mg/kg b. w.), male Wistar rats were treated with/without VD (1,000 IU/kg b. w., 30 days). Oxidative stress/inflammation and NOS/NO were assessed by flow cytometry, RT-qPCR, western blotting, and ELISA. A 3.3-fold decrease in serum 25(OH)D3 was established in diabetic rats, suggesting their VD deficient status. T2DM was associated with excess reactive oxygen species (ROS; 2.4-fold) and NO (2.5-fold) production in hepatocytes paralleled by elevated levels of myeloperoxidase (1.7-fold), carbonylated (2.8-fold) and nitrotyrosylated (1.7-fold) proteins in liver tissue vs. control, indicative of oxidative-nitrosative stress. Low-grade inflammation in diabetic liver was confirmed by increased NF-κB transcriptional activity (1.24-fold) and mRNA expression of proinflammatory cytokines TNF-α (3.5-fold) and IL-1β (2.2-fold) with alleviating mRNAs of anti-inflammatory cytokines IL-4 (1.7-fold) and IL-10 (2.6-fold), while TGF-β1 expression raised 1.4-fold vs. control. Higher iNOS and eNOS mRNAs (2.7- and 3.3-fold, respectively) and protein (2.1- and 3.2-fold, respectively) levels, as well as NOS activity (1.6-fold) were found in diabetic liver. VD supplementation restored 25(OH)D3, partially normalized NF-κB transcriptional activity and pro/anti-inflammatory cytokines, lowered hepatocellular ROS/NO, and oxidative protein modifications. However, VD had no effect on eNOS, IL-10 and TGF-β1 mRNAs. It also led to a further increase in myeloperoxidase, eNOS and iNOS proteins and NOS activity compared to diabetes. In conclusion, abnormal oxidative metabolism in T2DM is associated with enhanced NF-κB/NOS/NO response, which can be partially attenuated by VD treatment via normalization of pro-oxidative/pro-inflammatory processes. The paradoxical sustained increase in NOS expression in the presence of VD antioxidant activity likely improves hepatocellular NO bioavailability, ultimately reducing T2DM-associated liver injury.
Keywords: inflammatory cytokines; liver dysfunction; nitric oxide; oxidative-nitrosative stress; type 2 diabetes mellitus; vitamin D3.
Copyright © 2025 Shymanskyi, Lisakovska, Veliky, Mezhenska, Bilous, Siromolot, Khomenko, Labudzynskyi, Horid’ko and Pasichna.
Conflict of interest statement
The author(s) declared no potential conflicts of interest with respect to the research, authorship, and/or publication of this article.
Figures
Similar articles
-
The Effect of Hyperoxia on Nitric Oxide Metabolism in the Skeletal Muscle of Male Type 2 Diabetic Rats.Endocrinol Diabetes Metab. 2025 Sep;8(5):e70090. doi: 10.1002/edm2.70090. Endocrinol Diabetes Metab. 2025. PMID: 40755371 Free PMC article.
-
Renoprotective and antihypertensive mechanism of action of Clinacanthus nutans bioactive polysaccharides by suppression of reactive oxygen species/ nuclear factor/ matrix metalloproteinase (ROS/NF-ΚB/MMP-9) and upregulation of endothelial nitric oxide synthase/nitric oxide (eNOS/NO) pathways.J Mol Histol. 2025 Jun 28;56(4):209. doi: 10.1007/s10735-025-10481-9. J Mol Histol. 2025. PMID: 40580398
-
Hydrogen sulfide potentiates the protective effects of nitrite against myocardial ischemia-reperfusion injury in type 2 diabetic rats.Nitric Oxide. 2022 Jul 1;124:15-23. doi: 10.1016/j.niox.2022.04.004. Epub 2022 Apr 30. Nitric Oxide. 2022. PMID: 35504499
-
A systematic review of p53 regulation of oxidative stress in skeletal muscle.Redox Rep. 2018 Dec;23(1):100-117. doi: 10.1080/13510002.2017.1416773. Epub 2018 Jan 3. Redox Rep. 2018. PMID: 29298131 Free PMC article.
-
Treatment of periodontal disease for glycaemic control in people with diabetes mellitus.Cochrane Database Syst Rev. 2015 Nov 6;2015(11):CD004714. doi: 10.1002/14651858.CD004714.pub3. Cochrane Database Syst Rev. 2015. Update in: Cochrane Database Syst Rev. 2022 Apr 14;4:CD004714. doi: 10.1002/14651858.CD004714.pub4. PMID: 26545069 Free PMC article. Updated.
References
MeSH terms
Substances
LinkOut - more resources
Full Text Sources
Medical
Research Materials