. 2025 Jul 24:16:1601008.
doi: 10.3389/fimmu.2025.1601008. eCollection 2025.

CREB regulates Foxp3+ST-2+ TREGS with enhanced IL-10 production

Affiliations

CREB regulates Foxp3+ST-2+ TREGS with enhanced IL-10 production

Sudheendra Hebbar Subramanyam et al. Front Immunol. .

Abstract

Introduction: Regulatory T-cells (Tregs) are characterized by the expression of Foxp3, a master regulator involved in the development and function of Tregs. Foxp3 expression is dependent on activity of the Treg specific demethylated site (TSDR), which contains a CREB binding site. We aimed to find out how Foxp3 specific CREB deletion affects Treg expression and function.

Methods: Tregs from Foxp3creCREBfl/fl mice and wild type (CREBfl/fl ) mice were analyzed by flow cytometry. Cytokine analysis was performed by flow cytometry, ELISA and RT-qPCR. Gene expression analysis was performed using Affymetrix HTA2 assays, ATAC-sequencing, and Methylation-assays. For functional relevance, a CD4 T cell mediated transfer colitis was performed.

Results and discussion: Foxp3creCREBfl/fl mice showed increased frequencies of Tregs (CD25+/Foxp3+) in thymus, spleen and peripheral lymph nodes and in nonlymphoid organs including lung and colon, but decreased Foxp3 expression at the single cell level. Despite decreased Foxp3 expression, enhanced expression of the IL- 33 receptor (ST-2), IL-10, IL-13, and CREM was observed. CREB deficient Tregs were highly suppressive in vitro and prevented disease activity in a CD4 T cell mediated transfer colitis in an IL-10 dependent way. Mechanistically CREB fulfils dual roles in Tregs: (1) it promotes Foxp3 expression under Steady state conditions and (2) in cooperation with CREM, CREB restricts chromatin accessibility at the ST2 locus, thereby modulating IL-33 driven immune responses. This dual regulation balances FoxP3-dependent Treg stability with IL-10 mediated suppression of inflammation.

Keywords: CREB; CREM; Foxp3; IL-10; IL-33; ST2.


Conflict of interest statement

The authors declare that the research was conducted in the absence of any commercial or financial relationships that could be construed as a potential conflict of interest. The author(s) declared that they were an editorial board member of Frontiers, at the time of submission. This had no impact on the peer review process and the final decision.

Figures
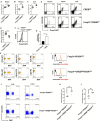
Figure 1
Figure 1
Genetic deletion of CREB in Foxp3+ cells increases the percentage of Tregs but downregulates their Foxp3 expression. (A) Statistical analysis of splenic Treg (CD4+CD25+Foxp3+) percentages from CREBfl/fl and Foxp3creCREBfl/fl mice (N = 9, four independently performed experiments, each with 2–3 age and sex-matched mice that were 6–9 weeks old). (B) Statistical analysis of Treg percentages within the thymuses (CD3+CD4spCD25+Foxp3+) of CREBfl/fl and Foxp3creCREBfl/f l mice (N = 7, three independently performed experiments, each with 2–3 age and sex-matched mice that were 6–9 weeks old). (C) Statistical analysis of Treg (CD4+CD25+Foxp3+) percentages from pLNs of CREBfl/fl and Foxp3CRECREBfl/fl mice (N =5, two independently performed experiments, each with 2–3 age and sex-matched mice that were 7–9 weeks old). (D) Density plot showing CD25+Foxp3+ cells gated on CD3+CD4+CD8- cells in the thymuses of CREBfl/fl and Foxp3creCREBfl/fl mice (left), CD25+Foxp3+ cells gated on CD4+ cells in the spleens of CREBfl/fl and Foxp3creCREBfl/fl mice (middle), and CD4+CD25+Foxp3+ cells in the pLNs from CREBfl/fl and Foxp3creCREBfl/fl mice (right). (E) Statistical analysis of mean fluorescent intensity (MFI) of Foxp3 in CREBfl/fl and Foxp3creCREBfl/fl CD4+CD25+ T cells (N=6, 3 independently performed experiments, each with two animals that were 6–8 weeks old and sex- and age-matched). (F) Representative histogram showing an overlay of Foxp3 expression in CD4+CD25+ cells from CREBfl/f l (black) and Foxp3creCREBfl/fl (grey) spleens. (G) RLM cells carrying a stable pGL3-TSDR-FoxPro luciferase plasmid were transfected either with an empty vector or CREB plasmid and stimulated with PMA, and luciferase activity was measured after 4 hours (N = 5). (H) Percentages of RFP+ cells within the CD4+ (on the left), CD19+ (in the middle), and CD8+ populations (on the right) in the spleens of Foxp3creROSARFP and Foxp3creCREBfl/flROSARFP mice. (I) Representative histogram showing the MFI of RFP expression in CD4+CD25- (black) and CD4+CD25+ cells (red) in the spleens of Foxp3creROSARFP and Foxp3creCREBfl/flROSARFP mice. (J) Percentage of RFP+ cells within the CD45+CD3+CD4+ population in the lungs and colons of Foxp3creROSARFP and Foxp3creCREBfl/flROSARFP mice. (K) Statistical analysis of CD45+CD3+CD4+RFP+ cells in the lung tissue of Foxp3CREROSARFP and Foxp3creCREBfl/flROSARFP mice (N=4, three independently performed experiments). (L) Statistical analysis of CD45+CD3+CD4+RFP+ cells in the colon tissue of Foxp3creROSARFP and Foxp3creCREBfl/flROSARFP mice (N=4, three independently performed experiments). Two-tailed, unpaired t-tests were used to test the significance. *p<0.05, **p<0.01, ***p<0.001, and ****p<0.0001 and the results are expressed as the mean ± SEM.
Figure 2
Figure 2
In vitro suppressive capacity of Tregs is enhanced in the absence of CREB. (A) WT CD4+ T cells from the spleens (Teff) were labeled with eFluor 660 and stimulated with anti-CD3/CD28 antibodies for 3 days. CD4+CD25+ T cells (Tregs) from CREBfl/fl or Foxp3creCREBfl/fl animals were added in different ratios (1:0, 1:0.5, 1:0.75, and 1:1). The proliferation of responder T cells was assessed in a eFluor 660 (eBioscience) dilution (N = 3) using flow cytometry (B) Representative density plots of (A). (C) Statistical analysis of MFI of helios in CREBfl/fl and Foxp3creCREBfl/fl CD4+Foxp3+ T cells (N = 5, 2 independently performed experiments, each with 2–3 animals that were 8 weeks old and sex-matched; a two-tailed Mann–Whitney test was performed to test for significance). (D) Representative TSDR methylation patterns of purified CD4+CD25+Nrp1+ Treg cells and CD4+CD25 conventional T cells isolated from the spleens of 6–8-week-old male mice (N = 4). Amplicons are vertically arranged, each representing a single CpG motif. The methylation rate of each motif was translated into a yellow-green-blue color code. *p<0.05, and all the results are expressed as the mean ± SEM.
Figure 3
Figure 3
Altered gene expression in CREB deficient Tregs. (A)Gene expression in Tregs from the spleens of CREBfl/fl and Foxp3creCREBfl/fl mice. Colors indicate significant upregulation or downregulation of at least 1.5-fold with a p-value not more than 0.05 (blue); regulation of at least 1.5-fold or regulation with p-value not more than 0.05 (red). (B) Selection of pathways and associated genes that were significantly enriched. (C) N-fold Il13 mRNA expression in splenic Tregs from CREBfl/fl and Foxp3creCREBfl/fl mice (N = 5, male, 8–10 weeks old) analyzed by RT-qPCR. Bars indicate the mean and error bars the SEM, and a two-tailed one-sample test was used to test for significance. D) N-fold Il10 mRNA expression in splenic Tregs from CREBfl/fl and Foxp3creCREBfl/fl mice (N = 5, male, 8–10 weeks old) analyzed by RT-qPCR. Bars indicate mean and error bars SEM, and a two-tailed one-sample test was used to test for significance. E) MACS-isolated T cells from spleens were stimulated ex vivo with anti-CD3/CD28 antibodies for 3 days and re-stimulated with PMA/Ionomycin in the presence of Golgi Plug™. A representative density plot shows IL-10 production in CD4+Foxp3+ cells. (F) Statistical analysis of IL-10 expression of Foxp3+ cells after treatment as in (E) (N = 3 independent experiments, each dot represents one animal, two tailed unpaired t-test. (G) CD4+CD25- T cells were stimulated with anti-CD3/CD28 antibodies in the presence/absence of 5 ng/mL TGF-β for 5 days. Percentages of Foxp3+ cells from six independently performed experiments were determined, each with the spleen from one mouse (N =13 CREBfl/fl and N=12 Foxp3creCREBfl/fl mice), and a two-tailed unpaired t-test was used to test for significance. (H) Statistical analysis of IL-10+ cells within Foxp3+ cells after treatment as in G). An unpaired two-tailed t-test was used to test for significance, each dot represents one animal, and error bars the SEM. (I) IL-10 in supernatants of CD4+CD25- T cells after stimulation with anti-CD3/CD28 antibodies in the presence of 5 ng/mL TGF-β for 5 days was measured by ELISA, and an unpaired two- tailed t-test was performed to test for significance. The bars indicate the mean and the error bars the SEM (N = 6). (J–L) Δ ct mRNA expression of cells after treatment as in (G) Each dot represents one animal and error bars the SEM. Two-tailed unpaired t-tests were used to test for significance. (M) Statistical analysis of splenic ST2+ cells within CD4+ and CD4+CD25+ cells of CREBfl/fl and Foxp3creCREBfl/fl mice. There were three independently performed experiments (N = 10 CREBfl/fl and N =11 Foxp3creCREBfl/fl mice), a two-tailed unpaired t-test was used to test for significance, and each dot represents one animal and error bars the SEM. (N) Representative density plot of M. (O) N-fold Crem mRNA expression in splenic Tregs from CREBfl/fl and Foxp3creCREBfl/fl mice (N = 3, male, 810 weeks old) cells analyzed by RT-qPCR. (P–T) Statistical analysis of ST2+ in CD4+ and CD4+RFP+ cells in Foxp3creROSARFP (N = 5) and Foxp3creCREBfl/flROSARFP (N = 5) in the (P) spleens, (Q) mesenteric lymph nodes, (R) thymuses, and (S) lungs. Bars indicate mean and error bars the SEM, and a two-tailed unpaired t-test was used to test for significance. (T) Statistical analysis of ST2+ in CD3+ and CD3+RFP+ cells in Foxp3creROSARFP (N = 5) and Foxp3creCREBfl/flROSARFP (N = 5) in the colon. A two-tailed unpaired t-test was used to test for significance. *p<0.05, **p<0.01, and ***p<0.001, and the results are expressed as the mean ± SEM.
Figure 4
Figure 4
Foxp3creCREBfl/fl CD4+ T cells induce only moderate inflammation in experimental colitis. Rag2-/- mice were adoptively transferred CD4+ CD25- wild-type cells (CREBfl/fl CD4+) or Foxp3creCREBfl/fl CD4+ CD25- T cells. Untreated Rag-/- mice were used as controls. Mice were weighed and sacrificed 5 weeks after transfer. (A) Body weight as a percentage of starting weight. A two-tailed unpaired t-test were used to test for significance (N = 11 CREBfl/fl , N = 9 Foxp3creCREBfl/fl recipients, and five control Rag-/- mice were analyzed in three independently performed experiments). (B) Results of histological JLS score of colon sections (two independently performed experiments; CREBfl/fl recipients N = 5, Foxp3creCREBfl/fl recipients N = 6; a two-tailed MannWhitney test was used). (C) Representative photomicrographs of H&E-stained colon sections imaged using 10x magnification. (D) Expression of inflammatory cytokines analyzed by RT-qPCR. Dots represent Δ ct values normalized to β-actin. Each dot represents one animal (ct levels are inversely proportional to the amount of target nucleic acid in the sample). Two-tailed unpaired t-tests were used to test for significance (N = 2 control mice, N = 4 CREBfl/f , N = 4 Foxp3creCREBfl/fl recipients). (E) Statistical analysis of IL-17+ cells within CD4+ cells in mLNs (three independently performed experiments, CREBfl/fl recipients N = 9, Foxp3creCREBfl/fl recipients N = 9). A two-tailed unpaired t-test was used. (F) Statistical analysis of IFN-γ+ cells within CD4+ cells in mLNs (Three independently performed experiments; CREBfl/fl recipients N = 11, Foxp3creCREBfl/fl recipients N = 9). A two-tailed unpaired t-test was used. (G) Representative dot plots of E and (F) *p<0.05 and **p<0.01 and the results are expressed as the mean ± SEM.
Figure 5
Figure 5
Foxp3creCREBfl/flROSARFP CD4+ T cells induce only moderate inflammation in experimental colitis, while CD4+RFP+ cells expand in peripheral tissues. Rag2-/- mice were adoptively transferred CD4+ CD25- wild-type cells (FoxpcreROSARFP CD4+) or Foxp3creCREBfl/lfROSARFP CD4+ CD25- T cells. Mice were weighed and sacrificed 5 weeks after transfer. (A) Body weight as a percentage of starting weight. A two-tailed unpaired t-test was used to test for significance (N = 5 FoxpcreROSARFP and N = 5 Foxp3creCREBfl/lfROSARFP recipient mice were analyzed in one independently performed experiment). B) Dot plots representing frequencies of RFP+ cells within the CD45+CD3+CD4+ population in the spleens of Rag2-/- mice that received cells from either Foxp3creROSARFP or Foxp3creCREBfl/flROSARFP mice. Percentages of CD45+CD3+CD4+RFP+ cells in the (C) spleens, (D) mLNs, (E) colons, (F) lungs, and (G) livers. A two-tailed unpaired t-test was used. **p<0.01, ***p<0.001, and ****p<0.0001 and the results are expressed as the mean ± SEM.
Figure 6
Figure 6
Reduced colitis in Foxp3creCREBfl/fl CD4+ T cell recipients depends on IL-10 signaling. Rag2-/- mice were adoptively transferred CD4+ wild-type cells (WT CD4+) or Foxp3creCREBfl/fl CD4+ T cells. Mice were either treated with an anti-IL10R antibody or an isotype control. (A) Body weight as a percentage of starting weight. Bars indicate mean and error bars the SEM (N=5 animals in each group; a two-tailed unpaired t-test was used; two independently performed experiments). (B) Representative photomicrographs of a H&E-stained colon section from CREBfl/fl and Foxp3creCREBfl/fl CD4+ T cell recipients that were treated with anti-IL10R, imaged using 10x magnification. (C) Results of histological JLS score of colon sections (two independently performed experiments with overall N=5 mice in each group; a two-tailed MannWhitney test was used to test for significance). *p<0.05 and **p<0.01 and the results are expressed as the mean ± SEM.
Figure 7
Figure 7
Genome-wide chromatin accessibility of CREBfl/fl and Foxp3creCREBfl/fl mice. (A) ATAC-seq foot printing analysis indicates a decrease in TF activity for CREB and CREM upon CREB KO and an increase in TF activity of NRF1 upon CREB KO (p-value < 0.05; z-test). (B, C) Example of genes with loss of chromatin accessibility upon CREB KO includes enhancer regions around SC-2/Il1rl1 (blue peaks) and an alternative promoter of CREM (red peaks) (adjusted p-value < 0.05; MACS2 diff. peak caller). (D) CD4+CD25- T cells were stimulated with anti-CD3/CD28 antibodies in the presence/absence of 5 ng/mL TGF-β for 5 days. Percentages of Foxp3+ cells from six independently performed experiments were determined, each with the spleen from one mouse (N = 13 CREBfl/fl , N = 12 Foxp3creCREBfl/fl , and N = 3 Foxp3creCREBfl/flCREM -/- mice; a two-tailed unpaired t-test was used to test for significance; bars indicate the mean and error bars the SEM). (E) Statistical analysis of MFI of Foxp3 in CREBfl/fl (N = 13), Foxp3creCREBfl/fl (N = 9), and Foxp3creCREBfl/flCREM -/- (N =3) CD4+CD25+ T cells. Bars indicate the mean and error bars the SEM, and a two-tailed unpaired t-test was used to test for significance. (F) Statistical analysis of ST2+ in CD4+ and CD4+CD25+ cells in CREBfl/fl (N = 5), Foxp3creCREBfl/fl (N = 6), and Foxp3creCREBfl/flCREM -/- (N =3) CD4+CD25+ T cells. Bars indicate the mean and error bars the SEM, and one-way ANOVA was used to test for significance. (G) Rag2-/- mice were adoptively transferred CREBfl/fl CD4 T-cells (CD4+CD25-) or Foxp3creCREBfl/fl CREM-/- CD4+ T cells (CD4+CD25-). Histological JLS score results of the colon sections (one experiment with overall N=4/5 mice in each group; a two-tailed MannWhitney test was used to test for significance). *p<0.05, **p<0.01, and ****p<0.0001 and the results are expressed as the mean ± SEM.

References

    1. Wildin RS, Ramsdell F, Peake J, Faravelli F, Casanova JL, Buist N, et al. X-linked neonatal diabetes mellitus, enteropathy and endocrinopathy syndrome is the human equivalent of mouse scurfy. Nat Genet. (2001) 27:18–20. doi: 10.1038/83707, PMID: - DOI - PubMed
    1. Bennett CL, Christie J, Ramsdell F, Brunkow ME, Ferguson PJ, Whitesell L, et al. The immune dysregulation, polyendocrinopathy, enteropathy, X-linked syndrome (IPEX) is caused by mutations of FOXP3. Nat Genet. (2001) 27:20–1. doi: 10.1038/83713, PMID: - DOI - PubMed
    1. Zhou X, Bailey-Bucktrout SL, Jeker LT, Penaranda C, Martínez-Llordella M, Ashby M, et al. Instability of the transcription factor Foxp3 leads to the generation of pathogenic memory T cells in vivo . Nat Immunol. (2009) 10:1000–7. doi: 10.1038/ni.1774, PMID: - DOI - PMC - PubMed
    1. Setoguchi R, Hori S, Takahashi T, Sakaguchi S. Homeostatic maintenance of natural Foxp3(+) CD25(+) CD4(+) regulatory T cells by interleukin (IL)-2 and induction of autoimmune disease by IL-2 neutralization. J Exp Med. (2005) 201:723–35. doi: 10.1084/jem.20041982, PMID: - DOI - PMC - PubMed
    1. Zorn E, Nelson EA, Mohseni M, Porcheray F, Kim H, Litsa D, et al. IL-2 regulates FOXP3 expression in human CD4+CD25+ regulatory T cells through a STAT-dependent mechanism and induces the expansion of these cells in vivo . Blood. (2006) 108:1571–9. doi: 10.1182/blood-2006-02-004747, PMID: - DOI - PMC - PubMed

MeSH terms

Substances

LinkOut - more resources