. 2025 Jul 24:16:1572701.
doi: 10.3389/fimmu.2025.1572701. eCollection 2025.

Identification of a coagulation-related classification and signature that predict disease heterogeneity for colorectal cancer and pan-cancer patients

Affiliations

Identification of a coagulation-related classification and signature that predict disease heterogeneity for colorectal cancer and pan-cancer patients

Junpeng Pei et al. Front Immunol. .

Abstract

Background: While increased coagulation is linked to cancer progression, the specific roles of coagulation-related genes in colorectal cancer (CRC) have not been extensively studied. This research identified coagulation-related subtypes (CRSs) and evaluated a coagulation-related risk score for its prognostic value in CRC.

Methods: CRC dataset from The Cancer Genome Atlas was analyzed to identify CRSs using nonnegative matrix factorization, which was validated across GSE39582 and pan-cancer datasets. A list of 285 coagulation-related genes was used to develop a risk signature via least absolute shrinkage and selection operator and multivariate Cox regression. We also assessed immune characteristics and treatment responses using single-sample gene set enrichment analysis, Tumor Immune Dysfunction and Exclusion, and immunophenoscore, and constructed an overall survival-related nomogram.

Results: CRS analysis categorized pan-cancers, including CRC, into three clusters: C1 with poor immune infiltration but better prognosis, C2 with high immune activity and prolonged survival, and C3 marked by dense immunosuppressive cells correlating with poor outcomes. Drug sensitivity analysis showed distinct responses across CRSs, influencing treatment choices. We developed a coagulation-related risk score based on F2RL2, GP1BA, MMP10, and TIMP1, which stratified CRC patients by outcome and correlated with distinct patterns of immune infiltration and therapeutic response. A validated nomogram incorporating age, TNM stage, and risk score accurately predicted overall survival, while experimental validations confirmed the bioinformatics predictions regarding TIMP1's role in CRC progression.

Conclusions: A coagulation-based classifier effectively categorizes CRC and potentially other cancers, interacting significantly with the immune microenvironment to influence disease progression and treatment responsiveness. This approach offers valuable insights for personalized cancer therapy.

Keywords: clustering; coagulation; colorectal cancer; precision treatment; tumor microenvironment.


Conflict of interest statement

The authors declare that the research was conducted in the absence of any commercial or financial relationships that could be construed as a potential conflict of interest.

Figures
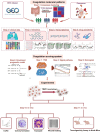
Figure 1
Figure 1
Workflow of the study.
Figure 2
Figure 2
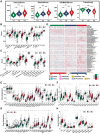
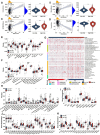
The genomic landscape of CRGs in CRC. (A) Mutation frequency of CRGs in TCGA-COADREAD. (B–D) According to different classification categories, missense mutation, SNP, and C>T mutation types accounted for a larger proportion. (E) Mutation burden in each sample. (F) The summary of the occurrence of each variant classification. (G) Top 10 mutated genes in CRC. (H) Mutual exclusion and synergistic heat maps of mutated genes in of CRGs in CRC. (I) Histogram of the proportion of gene alteration in CRC. (J) Gene alteration frequency of CRC patients in TCGA. (K) Histogram of the proportion of somatic copy number alteration in CRC. (L) The CNA frequency of CRGs. (M) Kaplan-Meier OS, PFS, DSS, and DFS curves between gene altered and gene unaltered group. (N) Kaplan-Meier OS, PFS, DSS, and DFS curves between copy number altered and copy number unaltered group.
Figure 3
Figure 3
Prognostic association of CRGs classifications. (A) Network diagram showing the interaction of 35 CRGs in CRC. The size of the circles indicates the p-value of each gene on survival prognosis. purple represents risk factors, and green dots represent favorable factors. The thickness of the lines indicates the correlation values between genes. The red and blue lines represent positive and negative correlations of gene regulation, respectively. (B) The consensus clustering heat map visualizes the degree of segmentation for 35 genes in 534 samples. (C) The average silhouette width represents the coherence of clusters. (D) The optimal number of clusters. (E) Principal component analysis plots. (F–I) Kaplan-Meier overall survival (F), disease-specific survival (G), progress-free survival (H), and disease-free survival curves (I). (J) The correspondence between CRS, CMS and survival status. (K) Heatmap presenting the clinicopathologic features of these subtypes. (L) Sankey diagram showing the relationship between CRS, MSI status, T stage, N stage, TNM stage and status. (M) The distribution characteristics of different clinicopathological factors in three subtypes. (*p<0.05 and ***p<0.001).
Figure 4
Figure 4
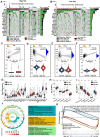
Immune landscape of CRS in the training set. (A) The violin plots display the immune score, stromal score, estimate score, and tumor purity score in the training cohort. (B, C) Immune cell infiltration (B) or functions (C) in the C1, C2 and C3 groups in the TCGA cohort. (D) Landscape of immune and stromal cell infiltration in the C1, C2 and C3 groups. Heatmap showing the normalized scores of immune and stromal infiltrations. (E–H) Boxplots representing the differential expression of HLA gene sets (E), chemokines (F), immune checkpoints (G), and T-cell stimulators (H). (*p<0.05, **p<0.01, ***p<0.001, and ****p<0.0001).
Figure 5
Figure 5
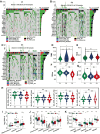
Mutation landscape of CRS and drug sensitivity. (A–C) Top 20 mutated genes in the C1 (A), C2 (B), and C3 (C) in the TCGA cohort. (D-H) Violin plots presenting the TMB score (D), TIDE score (E), RNAss (F), DNAss (G), and IPS scores (H) in CRSs. (I–K) drug sensitivity analysis for C1 (I), C2 (J), and C3 (K). (*p<0.05, **p<0.01, and ***p<0.001).
Figure 6
Figure 6
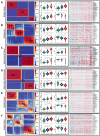
Immune microenvironment of CRSs in pan-cancer. (A–F) The immune microenvironment in representative cancer: bladder cancer (A), glioblastoma (B), adrenocortical cancer (C), kidney clear cell carcinoma (D), prostate cancer (E), and ovarian cancer (F). (*p<0.05, **p<0.01, and ***p<0.001).
Figure 7
Figure 7
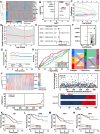
Construction and validation of the coagulation-related prognostic signature in training set. (A) Heatmaps of the signatures in the screening set after differential analysis. (B) Volcano plot of signatures after differential analysis. (C, D) Lasso Cox analysis of 14 differential expressed CRGs. (E) Multivariate Cox analysis uncovered 4 CRGs associated most with overall survival. (F) The coefficient of the 4 genes identified by Cox analysis. (G) Time-dependent C-index plot for the risk score and individual genes. (H) The AUC assess the accuracy of the risk score. (I) Sankey plot summarized the relationships among the clusters, risk score and survival status. (J) Survival status and risk score of the two risk groups. (K–N) Kaplan-Meier OS (K), DSS (L), PFS (M), and DFS (N) curves for patients with high- or low-risk scores in TCGA cohort.
Figure 8
Figure 8
Immune association of coagulation-related risk score. (A–D) Violin plots comparing the immune score (A), stromal score (B), ESTIMATE score (C), and tumor purity (D) between high- and low-risk groups. (E) Box plot comparing scores for 16 immune cell types between high- and low-risk groups. (F) Box plot comparing scores for 13 immune-related functions high- and low-risk groups. (G) Verification of ssGSEA results by seven other algorithms, namely TIMER, CIBERSORT, CIBERSORT-ABS, QUANTISEQ, MCPCOUNTER, XCell, and EPIC. (H–K) Boxplots representing the fraction of immune cell types (H), differential expression of T-cell stimulators (I), HLA gene sets (J), chemokines (K). (*p<0.05, **p<0.01, and ***p<0.001).
Figure 9
Figure 9
Mutation landscape and drug sensitivity of risk score. (A, B) Top 20 mutated genes in the high- (A) and low-risk group (B). (C–F) Violin plots presenting the TMB score (C), RNAss (D), DNAss (E), and TIDE score (F). (G) The differential expression of checkpoint genes in the two risk groups. (H-I) Drug sensitivity between the low- (H) and high-risk (I) group. (J) GO analysis of DE-CRGs in terms of biological process, cellular component and molecular function. (K) GSEA of the DE-CRGs showing the different pathways in the low-risk group and in the high-risk group. (*p<0.05, **p<0.01, and ***p<0.001).
Figure 10
Figure 10
Development and assessment of the nomogram. (A) Univariate regression. (B) Multivariate regression of the clinicopathological indicators and gene signatures. (C) A comprehensive nomogram for predicting CRC patients’ survival probability in training set. (D) Time-dependant c-index plot for the nomogram and other clinical factors in training set. (E) Calibration curves of the nomogram at 1-, 3-, and 5-year intervals in training set. (F) DCA curves of the clinicopathological indicators and this nomogram in training set. (G) A comprehensive nomogram in validation set. (H) Time-dependant c-index plot in validation set. (I) Calibration curves in validation set. (J) DCA curves in validation set.
Figure 11
Figure 11
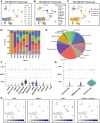
Single-cell profiles reveal CRGs expression patterns. (A) The identified cell clusters in colon cancer tissues based on the GSE146771 dataset. (B) The identified cell types in colon cancer tissues based on the GSE146771 dataset. (C) UMAP plot of immune, malignant and stromal cells from colon cancer scRNA-seq data. (D, E) Cell proportion in 10 colon cancer samples. (F, G) Violin plot for displaying the expression levels of CRGs in all cell types. (H) UMAP plots for visualizing the abundance distribution of CRGs.
Figure 12
Figure 12
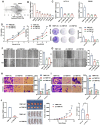
TIMP1 promotes malignant proliferation of CRC cells. (A) Distribution of mRNA expression across different cell lines obtained from the CCLE database. (B) qRT-PCR results of TIMP1 expression level in NCM460 and CRC cell lines. (C) Efficiency of TIMP1 knockdown in HCT116 and SW480 cells. (D) CCK-8 assay measuring cell viability in HCT116 and SW480 cells, respectively. (E) Colony formation assay assessing the colony-forming ability of HCT116 and SW480 cells. (F, G) Wound healing assay of migration in HCT116 (F) and SW480 (G) cells, respectively. (H, I) Transwell assay of migration and invasion in HCT116 (H) and SW480 (I) cells, respectively. (J) TIMP1 promotes CRC cell growth in vivo. (*p<0.05, **p<0.01, and ***p<0.001).

References

    1. Palta S, Saroa R, Palta A. Overview of the coagulation system. Indian J Anaesth. (2014) 58:515–23. doi: 10.4103/0019-5049.144643, PMID: - DOI - PMC - PubMed
    1. Golebiewska EM, Poole AW. Platelet secretion: from haemostasis to wound healing and beyond. Blood Rev. (2015) 29:153–62. doi: 10.1016/j.blre.2014.10.003, PMID: - DOI - PMC - PubMed
    1. Khorana AA, Ahrendt SA, Ryan CK, Francis CW, Hruban RH, Hu YC, et al. Tissue factor expression, angiogenesis, and thrombosis in pancreatic cancer. Clin Cancer Res. (2007) 13:2870–5. doi: 10.1158/1078-0432.ccr-06-2351, PMID: - DOI - PubMed
    1. Ueno T, Toi M, Koike M, Nakamura S, Tominaga T. Tissue factor expression in breast cancer tissues: its correlation with prognosis and plasma concentration. Br J Cancer. (2000) 83:164–70. doi: 10.1054/bjoc.2000.1272, PMID: - DOI - PMC - PubMed
    1. Regina S, Valentin J-B, Lachot S, Lemarié E, Rollin J, Gruel Y. Increased tissue factor expression is associated with reduced survival in non-small cell lung cancer and with mutations of Tp53 and Pten. Clin Chem. (2009) 55:1834–42. doi: 10.1373/clinchem.2009.123695, PMID: - DOI - PubMed

Substances