. 2025 Jul 24:19:1590732.
doi: 10.3389/fncel.2025.1590732. eCollection 2025.

Investigation of early axonal phenotypes in an iPSC-derived ALS cellular model using a microfluidic device

Affiliations

Investigation of early axonal phenotypes in an iPSC-derived ALS cellular model using a microfluidic device

Asako Otomo et al. Front Cell Neurosci. .

Abstract

Introduction: Amyotrophic lateral sclerosis (ALS) is a progressive neurodegenerative disease caused by the loss of upper and lower motor neurons. Mutations in the FUS/TLS gene have been reported as the second most common mutation in Japanese patients with familial ALS. In recent years, lower motor neurons (LMNs) differentiated from induced pluripotent stem cells (iPSCs) derived from ALS patients have been widely used to analyze the mechanisms of neuronal cell death and degeneration.

Methods: In this study, we developed a microfluidic device designed to observe axonal growth, morphology, and trafficking at high resolution in neurons derived from induced pluripotent stem cells (iPSCs) and tested whether our microfluidic device effectively evaluates neurodegenerative phenotypes. We used iPSCs carrying homozygous FUS/TLS mutations (FUS_H517D) to induce LMNs by expressing NEUROG2, ISL1, and LHX3 under the control of the tetracycline regulation system.

Results and discussions: After seven days of in vitro differentiation (DIV7), we confirmed that over 95% of iPSCs differentiated into HB9-positive LMNs. Notably, the cell viability of FUS_H517D LMNs was comparable to that of LMNs differentiated from iPSCs without the FUS/TLS mutation at DIV7. However, by DIV14 and DIV21, the viability of FUS_H517D LMNs was notably lower than that of control LMNs, indicating degeneration of FUS_H517D LMNs after differentiation. Using our microfluidic device, we assessed axonal phenotypes in FUS_H517D LMNs. Under oxidative stress conditions, we observed that the axonal length of FUS_H517D LMNs was significantly shorter than that of control cells as early as DIV7, with this axonal growth restriction becoming more pronounced by DIV11. This suggests that axonal growth restriction is an early detectable phenotype in degenerating neurons. Additionally, we examined mitochondrial trafficking within axons in our device, which is often disrupted in degenerative neurons. Our results showed a significant increase in the number of motile mitochondria in FUS_H517D LMNs, with retrograde transport accounting for a large portion of trafficking. Our microfluidic device-based culture and evaluation system using FUS_H517D LMNs offers a valuable ALS cellular model focused on early axonal phenotypes. This approach contributes to the study of molecular mechanisms underlying axonal degeneration in ALS.

Keywords: FUS/TLS; amyotrophic lateral sclerosis (ALS); iPSCs; lower motor neurons; microfluidic device.


Conflict of interest statement

The authors declare that the research was conducted in the absence of any commercial or financial relationships that could be construed as a potential conflict of interest.

Figures
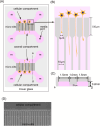
Diagram illustrating a neuronal cell culture device. (A) Shows the overall layout with cellular and axonal compartments, micro-slits, and media ports. (B) Details neuron alignment with measurements of 3 µm and 10 µm for micro-slits; total height is 100 µm. (C) Displays cross-sectional measurements, including 1.5 mm, 1.0 mm, and 0.2 mm dimensions. (D) Depicts an actual image of micro-slits below the cellular compartment.
FIGURE 1
A schematic image of the microfluidic device. (A) The illustration shows a schematic image of the microfluidic device. The device was fabricated by PDMS and bound to cover glass around 0.17 mm thickness. The PDMS chip has two independent culture areas with four independent media ports (media ports were indicated and labeled with “m”). Two of them supply media to the cellular compartment where cells are cultivated, and the other two media ports supply media to the axonal compartment where axons elongate. Those two compartments were connected with 1,000 μm long micro-slits. (B) The illustration shows the structure of micro-slits in the device. Micro-slits facing the cells were designed to be 3 μm wide, 4 μm high, and have a 100 μm long fine structure to avoid cell migration. (C) The illustration shows a schematic image of a cross-section of the device indicated by dash line a-a’ in (A). Cellular and axonal compartments have a 1.5 mm length, are 4 mm wide, and are 0.2 mm high. (D) The phase contrast image of micro-slits in the device was shown. The scale bar indicates 20 μm.
Panel A shows immunofluorescence images of cells stained for NF200 (red), HB9 (green), and DAPI (blue). The merge column combines these stains. Rows are labeled Control_4, Control_9, FUS_1_1, FUS_1_4, and FUS_2_3. Panel B is a bar chart depicting the percentage of HB9 positive cells, with control and FUS transfections indicated. Bars are color-coded, with controls in blue and FUS transfections in pink.
FIGURE 2
Tet-on NEUROG2/ISL1/LHX3 iPSCs express LMN markers. (A) Immunofluorescent co-staining of HB9 (green) and NF200 (red) on the culture at DIV7. Nuclei were stained by DAPI (blue). The scale bars indicate 50 μm. Control_4 and Control_9 were established from control iPSC, and FUS_1_1, FUS_1_4, and FUS_2_3 were established from iPSC clones carrying homozygous FUS_H517D mutations. (B) HB9-positive cells among DAPI-stained cells were counted, and the percentage of HB9-positive cells in images is shown in the graph. Experiments were conducted independently twice. The number of cells used for this analysis: Control_4; n = 1,709, Control_9; n = 1,497, FUS_1_1; n = 741, FUS_1_4; n = 1259, FUS_2_3; n = 629.
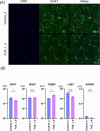
(A) Fluorescent microscopy images showing cell cultures. Left to right: DAPI stained nuclei in blue, CHAT expression in green, and merged images. Two rows compare Control_4 and FUS_1_4 samples at a scale of 100 micrometers. (B) Bar graphs depicting relative quantification (RQ) of gene expression for CHAT, MNX1, TUBB3, LHX3, and NANOG, comparing Control_4 and FUS_1_4 samples. Significant differences are marked with an asterisk, and non-significant differences are labeled “n.s”.
FIGURE 3
FUS_H517D Tet-on LMNs express CHAT and MNX1(HB9). (A) Immunofluorescent staining of CHAT (green) on the culture at DIV35 in Control_4 and FUS_1_4. Nuclei were stained by DAPI (blue). Z-stack images were captured by confocal microscopy and presented as maximum projection images. The scale bar indicates 100 μm. (B) The relative quantities of CHAT, MNX1, TUBB3, LHX3, and NANOG expressions in Control_4 and FUS_1_4 LMNs at DIV 14 are shown. The relative quantities were calculated based on the marker’s expression levels in iPSCs before differentiation. Experiments were conducted independently three times. A representative series of results is shown. The statistical difference between groups was assessed by the Mann-Whitney Test. *p < 0.05.
Graph (A) shows a bar chart comparing PrestoBlue assay readings for Control_4 and FUS_1_4 groups at DIV7, with similar values around three times ten to the sixth. Graph (B) displays cell viability data at DIV7, DIV14, and DIV21 for the same groups. Control_4 shows higher viability at DIV14, marked with an asterisk indicating significance, while other time points show similar results between groups. Control_4 is blue, and FUS_1_4 is purple.
FIGURE 4
FUS_H517D Tet-on LMNs represent lower cell viability. (A) The cell viability of FUS_H517D Tet-on LMNs and control LMNs at DIV7 were analyzed using PrestBlue reagent, and the results are shown by fluorescent intensities. (B) Cell viabilities of FUS_H517D Tet-on LMNs and control LMNs at DIV14 and DIV21 were shown. The results are shown as a ratio of cell viability at DIV14 and DIV21 to that at DIV7. Experiments were repeated three times, and representative results are shown. The difference between the groups was assessed using a two-way ANOVA followed by a Bonferroni post hoc test.*p < 0.05.
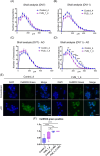
Graphs and images displaying Sholl analysis and CellROX staining results. Graphs (A-D) illustrate intersections over distance for Control_4 and FUS_1_4 conditions with and without AO treatment. Series E shows microscopy images of Control_4 and FUS_1_4 stained with DAPI and CellROX Green, both conventional and with AO treatment. Image F is a box plot comparing CellROX green positivity. Statistical significance is noted with asterisks.
FIGURE 5
FUS_H517D Tet-on LMNs represent lower neurite complexity at DIV11 but not DIV7 under oxidative stress. (A) The results of the Sholl analysis at DIV7 are shown. The horizontal axis indicates the distance from the center of the cell, whereas the vertical axis indicates the average number of cross points on concentric circles passed through by neurites. (B) The results of the Sholl analysis at DIV11 are shown. (C) The results of the Sholl analysis at DIV7 under oxidative stress are shown. (D) The results of the Sholl analysis at DIV11 under oxidative stress are shown. Each group used over 50 cells to analyze neurite morphology. The difference between the groups was assessed by two-way ANOVA followed by Tukey’s multiple comparisons test. *p < 0.05, **p < 0.01, ***p < 0.001, ****p < 0.0001. (E) CellROX Green staining of conventional and oxidative stress conditions. ROS were detected using CellROX Green (Thermo Fisher Scientific), a fluorescent dye that binds to DNA and emits bright green fluorescence upon oxidation by ROS. Cells were cultured for 24 h in antioxidant-free (−AO) media, after which ROS levels were assessed at DIV12. (F) The Ratio of CellROX green-positive cells in the image was shown. More than 10 images from two independent samples were analyzed. (The number of cells used for this analysis: Control_4 conventional; n = 205, Control_4−AO; n = 224, FUS_1_4 conventional; n = 220, FUS_1_4−AO; n = 255). The difference among medians was assessed by the Kruskal-Wallis Test and statistical significance was tested by Dunn’s multiple comparisons test. *p < 0.05, **p < 0.01, ****p < 0.0001.
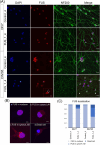
Panel A shows immunofluorescence images with DAPI (blue), FUS (red), and NF200 (green) staining across different conditions, revealing varying FUS localization in neurons. Panel B displays sub-images highlighting FUS in nuclei, cytosol, and a dead cell. Panel C presents a bar graph illustrating FUS localization in nucleus and cytosol, and the proportion of dead cells under different conditions (DIV7 and DIV35).
FIGURE 6
Extranuclear FUS was detected in FUS_H517D Tet-on LMNs. (A) Immunofluorescent co-staining of NF200 (green) and FUS (red) in Control_4 and FUS_1_4 LMNs at DIV7 and DIV35. Nuclei were stained by DAPI (blue). The scale bars indicate 20 μm. At DIV7, both Control_4 and FUS_1_4 LMNs, FUS localization was mainly detected in the nucleus. On the other hand, extranuclear localization of FUS was detectable in FUS_1_4 LMNs at DIV35, as indicated by white arrows in the enlarged image of FUS staining (The scale bar indicates 5 μm). White arrows and arrowheads indicate FUS aggregation and swollen axons, respectively. *FUS_1_4 DIV35 DAPI (blue) and FUS (red) staining are used to indicate the cell shown enlarged in FUS (red) staining. (B) Representative images of FUS localization. (a) nuclear localization of FUS, (b) extranuclear (cytosolic) localization of FUS_#1, (c) extranuclear (cytosolic) localization of FUS_#2 (with aggregation), and (d) condensed nuclei lacking detectable FUS localization. The scale bars indicate 5 μm. (C) Quantification of the FUS localization. FUS localization was categorized into three populations based on the example shown in (B). The ratio of the FUS cytoplasmic localization was dramatically increased in FUS_1_4 at DIV35. Quantification was performed using 5–6 independent confocal images from two independent samples at each time point (The number of cells used for this analysis: Control_4 DIV7: n = 168, DIV35: n = 139, FUS_1_4 DIV7: n = 173, DIV35: n = 202). The difference in frequencies among groups was analyzed using a χ2 test, which revealed a statistically significant result (p < 0.001).
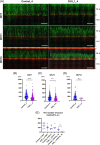
Fluorescent microscopy images and scatter plots showing axon growth in a study. Panel A presents three time points (DIV7, DIV11, DIV14) with control and FUS_1_4 samples. Axons appear in green and red, with annotations for migration surface (m.s) and axon compartment (a.c). Panels B, C, and D display scatter plots comparing axon lengths for each time point, with significant differences marked (****, ***, n.s.). Panel E shows a bar graph comparing the number of axons reaching the axon compartment, with significant differences noted.
FIGURE 7
Axonal growth of FUS_H517D Tet-on LMNs was suppressed in oxidative stress. (A) Representative immunofluorescent co-staining of Alexa488 Phalloidin (green) and NF200 (red) on Control_4 and FUS_H517D Tet-on LMNs in the device at DIV7, DIV11, and DIV14 are shown. The Scale bars indicate 100 μm. m.c and a.c stand for micro-slits or axonal compartments, respectively. (B) The length of the axon at DIV7 under oxidative stress. The length of the axon extending from the exit of the micro-slits to the tip of the axon within the axon compartment was traced and measured. Median; Control_4, 198.8 μm (n = 138 from one chip, two independent a.c) and FUS_H517D, 127.3 μm (n = 180 in one chip, including two independent a.c). The difference between medians was assessed by the Mann-Whitney Test. ****p < 0.0001. (C) The axon length elongates in the axonal compartment at DIV11 under oxidative stress. Median; Control_4, 162.5 μm (n = 204 in one chip, including two independent a.c) and FUS_H517D, 126.0 μm (n = 226 in one chip, including two independent a.c). The difference between medians was assessed by the Mann-Whitney Test. ***p < 0.001. (D) The length of the axon elongates in the axonal compartment at DIV14 under oxidative stress. Median; Control_4, 147.3 μm (n = 119 in one chip, including two independent a.c) and FUS_H517D, 109.9 μm (n = 14 in one chip, including two independent a.c). The difference between medians was assessed by the Mann-Whitney Test. Experiments are conducted three times for DIV7 and DIV11, and once for DIV14 and DIV16, and representative data are shown. (E) The number of axons detected in a single a.c. is shown. The number of axons reached a.c at each DIV was compared by a student’s t-test. *p < 0.05.
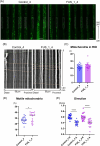
Fluorescence microscopy images and data visualizations comparing Control_4 and FUS_1_4 cell samples. (A) Shows green-stained mitochondria. (B) Kymographs of mitochondrial movement over time. (C) Bar graph quantifying mitochondria in the region of interest, with Control_4 and FUS_1_4 shown in blue and pink respectively. (D) Scatter plot displaying the percentage of motile mitochondria, with a notable difference marked by an asterisk. (E) Scatter plot illustrating directionality ratios, showing significant distinctions indicated by asterisks.
FIGURE 8
FUS_H517D Tet-on LMNs show altered mitochondria trafficking. (A) Representative images that captured micro-slits in the device. MitoTracker-positive mitochondria (green) were detected in axons in the micro-slits. White dash boxes shown in the pictures indicate the ROI used for Kymograph preparation and analysis. Each ROI was set along with a micro-slit 500 μm away from the cellular compartment. 58 μm long single axons and axon bundles less than 1.6 μm wide were analyzed. (B) Representative Kymographs are shown. The horizontal axis indicates the orientation of the axon; the vertical axis indicates the time course. Green dash lines demonstrate the trajectory of anterograde transport, whereas orange dash lines demonstrate the trajectory of retrograde transport. (C) The average number of mitochondria in each observation field is shown. The average number of mitochondria in ROI was comparable between Control_4 and FUS_H517D Tet-on LMNs. [Median; Control_4, 22.75 (n = 21) and FUS_H517D, 22.94(n = 20)]. (D) The percentage of motile mitochondria is shown. [Median; Control_4, 26.71 (n = 21) and FUS_H517D, 35.03 (n = 20)]. Mann-Whitney Test. *p < 0.05. (E) Direction of transport is analyzed. The ratio of retrograde transport shares a large part of trafficking in both Control_4 and FUS_H517D Tet-on LMNs. The difference between the groups was assessed by the Kruskal-Wallis Test, followed by Dunn’s multiple comparisons test. ****p < 0.0001.

References

    1. Abo-Rady M., Kalmbach N., Pal A., Schludi C., Janosch A., Richter T., et al. (2020). Knocking out C9ORF72 exacerbates axonal trafficking defects associated with hexanucleotide repeat expansion and reduces levels of heat shock proteins. Stem Cell Rep. 14 390–405. 10.1016/j.stemcr.2020.01.010 - DOI - PMC - PubMed
    1. Akçimen F., Lopez E. R., Landers J. E., Nath A., Chiò A., Chia R., et al. (2023). Amyotrophic lateral sclerosis: Translating genetic discoveries into therapies. Nat. Rev. Genet. 24 642–658. 10.1038/s41576-023-00592-y - DOI - PMC - PubMed
    1. Alami N. H., Smith R. B., Carrasco M. A., Williams L. A., Winborn C. S., Han S. S. W., et al. (2014). Axonal transport of TDP-43 mRNA granules is impaired by ALS-Causing mutations. Neuron 81 536–543. 10.1016/j.neuron.2013.12.018 - DOI - PMC - PubMed
    1. Arber S., Han B., Mendelsohn M., Smith M., Jessell T. M., Sockanathan S. (1999). Requirement for the homeobox gene Hb9 in the consolidation of motor neuron identity. Neuron 23 659–674. 10.1016/S0896-6273(01)80026-X - DOI - PubMed
    1. Bilsland L. G., Sahai E., Kelly G., Golding M., Greensmith L., Schiavo G. (2010). Deficits in axonal transport precede ALS symptoms in vivo. Proc. Natl. Acad. Sci. U. S. A. 107 20523–20528. 10.1073/pnas.1006869107 - DOI - PMC - PubMed

LinkOut - more resources