[Preprint]. 2025 Jul 21:2025.04.27.649857.
doi: 10.1101/2025.04.27.649857.

Genetic Modulation of Lifespan: Dynamic Effects, Sex Differences, and Body Weight Trade-offs

Affiliations

Genetic Modulation of Lifespan: Dynamic Effects, Sex Differences, and Body Weight Trade-offs

Danny Arends et al. bioRxiv. .

Abstract

The dynamics of lifespan are shaped by DNA variants that exert effects at different ages. We have mapped genetic loci that modulate age-specific mortality using an actuarial approach. We started with an initial population of 6,438 pubescent siblings and ended with a survivorship of 559 mice that lived to at least 1100 days. Twenty-nine Vita loci dynamically modulate the mean lifespan of survivorships with strong age- and sex-specific effects. Fourteen have relatively steady effects on mortality while other loci act forcefully only early or late in life and with polarities of effects that invert. A distinct set of 19 Soma loci shape the negative correlation between weights of young adults with their life expectancies-much more strongly so in males than females. Another set of 11 Soma loci shape the positive correlation between weights at older ages with life expectancies. The Vita and Soma loci share 289 age-dependent epistatic interactions (LODs ≥3.8) but fewer than 4% are common to both sexes. We provide two examples of how to move from maps toward potential mechanisms. Our findings provide an empirical bridge between evolutionary theories on aging and genetic and molecular causes. These loci and their interactions are key to begin to understand the impact of interventions that may extend healthy lifespan in mice and even in humans.


Conflict of interest statement

Competing interests The authors declare no competing interests.

Figures
Extended Data 1 |
Extended Data 1 |. Sex-stratified and combined maps of mean lifespans of survivorships.
a,b,c, This extends the content of Fig. 1d to included female and male survivorship maps across the entire range of survivorships. Other conventions as in Fig. 2d. The LOD threshold is defined by the horizontal dashed lines for each survivorship. Note that only every third survivorship is plotted, accounting for some Vita loci that do not reach significance here.
Extended Data 2 |
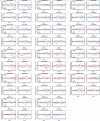
Extended Data 2 |. Actuarial effect size plots of genotypes (CH, CD, BH, and BD)
Vita loci genotype effect plots. Trios of effect size plots as described in detail in the legend to Figs 1 and 2. Each trio for the 29 Vita loci includes combined data for both sexes (left), for females only (middle), and for males only (right). To understand the genetic sources that account from timing changes in mortality rates it is helpful to compare these more complex genotype plot to pairs of haplotype plots in Extended Data 3 and 4.
Extended Data 3 |
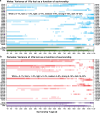
Extended Data 3 |. Vita loci effect plots for maternal (C vs B) and paternal (H vs D) haplotypes
Vita loci haplotype effect plots. There are two trios of effect size plots for each Vita locus. The upper trio (blue and purple shades) give the difference in actuarial effects of the maternal haplotypes—C and B. The lower trio (pink and beige shads) give the difference in effects of the paternal haplotypes—H and D. Each These plots are symmetric and easier to interpret than the matched genotype plots in Extended Data Fig. 1. However, they generally have lower LOD scores.
Extended Data 4 |
Extended Data 4 |. Age-dependent mortality difference by haplotypes (maternal C and B, paternal H, and D)
Mortality rates of maternal and paternal haplotypes of Vita loci. Relative mortality rate difference between the maternal pair of haplotypes (C and B on the top of each panel) and between the paternal pair of haplotype (H and D on the bottom of each panel). Here we have used a LOESS smoother with a relatively short α span 0.2. At any one age only the haplotype with the higher rate of mortality is shown, accounting for abrupt reversals.
Extended Data 5 |
Extended Data 5 |. Direct comparisons of all methods of display of survivorship effect sizes of genotypes, haplotypes, and mortality rates of a Vita14b in females (left) and males (right).
a,b, The actuarial genotype effect plots of Vita14b (see Fig. 2b) for both sexes. c,d, Corresponding haplotype-specific plots. g,h, Age-dependent relative mortality rate differences using a LOESS smoother with a span over the entire range of ages (α of 1) that averages mortality difference at a high level. While effects are similar between sexes, only the much stronger male effect in b reaches significance—the sum of the two reinforcing haplotype effects. i,j. An analysis of age-dependent differences in mortality rates using a LOESS with a span of 0.2 that exposes much finer details of both age-dependent and haplotype-dependent differences in mortality. Extended Data 4 uses only this finer-grained smoother.
Extended Data 6 |
Extended Data 6 |. Dynamics and variance of 29 Vita loci as a function of sex and survivorship.
a,b, Variance contributions of Vita loci were estimated for each survivorship and sex: males in a and females in b with intensity of colors indicating the approximate fraction of variance explained, where white = 0–1%, faint = 1–2%, light = 2–4%, medium 4–8%, strong 8–16%, dark 16–32%. Non-genetic experimental sources of variance (Ve) are provided in green for males and purple for females. Drug is variance attributable to multiple nominally ineffective supplementary drug treatments versus the standard chow diet. Cohort is variance attributable to the nine annual cycles of production of UM-HET3 mice from late spring through late fall between 2004 and 2013 (2008 was a hiatus year). Site is variance associated with the three ITP sites: The Jackson Laboratory, The University of Michigan, and University of Texas Health San Antonio.
Extended Data 7 |
Extended Data 7 |. Body Mass loci at five ages.
a, Female maps. b, Male maps. c, Combined maps in which all significant Mass loci have been labeled. Note that three of the 28 Mass loci are more distinct in the female map (Mass6a, Mass6b, and Mass11a) than in combined or male maps. Mass11b is more distinct in the male map. At all ages the mapping model compensates for drug treatment, cohort year, and site, and in the case of the combined sexes also adjusts for sex. Compare (c) with Fig. 5a, but note that color assignments are different here. d, Table of sample sizes for each sex and for the sites. Animals at 42 days were only weighed for the first four cohorts, accounting for the lower sample size. The lower sample size at 730 days is due in part to mortality.
Extended Data 8 |
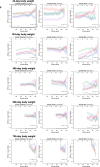
Extended Data 8 |. Soma actuarial effect size plots.
a, An example of one of 30 Soma loci full actuarial effect size plots. The original figure cannot be optimized as a single-page PDF and is best viewed within Inkscape or Adobe Illustrator so that readers can examine individual or sets of Soma loci. The figure consists of 30 layers of loci, aligned on top of each other. Each locus is given at the five ages at which mice were weighed. In this PDF version, we have reproduced only Soma3b (also see Fig. 4i,j for more context). The Adobe Illustrator format file is available upon request in which we illustrate all 30 overlapping Soma loci.
Extended Data 9 |
Extended Data 9 |. Epistatic interaction plots for the T42, T365, T740 and T905 survivorships.
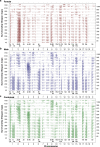
a,g, Overview of all epistatic interactions in survivorship with LODs ≥ 3.8 (thin lines), above 4.2 (medium lines), and above 4.5 (thick lines). c–h, Similar plots of the three older survivorships—T365, T740, and T905—using the same conventions. Chromosomes are labeled with abbreviated Vita and Soma symbols. Color and type of lines define partnership types (orange lines are Vita-Soma pairs). I,j, An overlay of all four survivorships that mainly highlights the greater cumulative numbers male than female interactions. This pair of circle plots is a set of overlapping layers useful to directly compare different survivorships and the Adobe Illustrator format is available upon request. Number of epistatic links for both males and females is given in the lower right corner of each female plot. Few epistatic interactions overlap in both sexes. All values are given in Supplementary Table 12.
Fig. 1 |
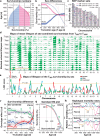
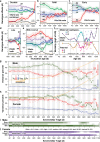
Fig. 1 |. Mortality, sex differences, and Vita survivorship loci.
a, Survivorships of mice stratified by the minimum inclusion age starting at a population of 6,438 at our base truncation age (T-age) of T42 and extending to a high of T1100, This final survivorship has 559 mice. The first death was at 46 days, the last death at 1456 days. 364 more males (blue bars) were entered into the study, but by T530 n/sex was matched. F+ denotes the proportional survival advantage of females (darker red bars, 4% at T365). Truncation ages (left y-axis) and numbers of survivors on the right y-axis. b, Sex differences in mean lifespans of the T42 to T1100 survivorships. The 81-day difference at T42 is neutralized by T725. Kaplan-Meier (KM) estimators for both sexes are superimposed. c, Ideogram of chromosomes and approximate megabase (Mb, GRCm38/mm10) of SNPs used to define maternal (C vs B) and paternal haplotypes (H vs D). d, Stacked survivorship maps for sex-combined data from T365 to T1085. We provide corresponding versions of panel d stratified by sex and over a wider age range in Extended Data 1. e, The map of T365 corresponds to the lowest tier of panel d but now with resolution of female (red), male (blue), and combined (green) plots. The red triangle marks the Vita1a locus. f, Actuarial genetic effect size plots from T42 to T1100. The y-axis defines the mean lifespan differences of survivorships for the four genotypes as a function of truncation age (x-axis) relative to the average of all four genotypes. LOD scores are plotted above the x-axis with an orange line at P <.05. The trios of faint vertical lines in f-h are for help in comparing these three different plot types. Red and blue triangles mark inflection points in mean lifespan of BD and CD survivorship at T365 and T950. g, KM plot of survival stratified by the four genotypes with arrowheads. h,i, Plots of age-dependent differences in relative mortality rates at Vita1a in females (h) and males (i). Each panel is divided into an upper maternal block with mortality rates of the C and D maternal haplotypes, and a lower paternal block with relative mortality rates of paternal D and H haplotypes. Deviations away from zero (no difference) in either direction signify a relative increase in mortality for that haplotype relative to the alternative haplotype. Note that the D haplotype is strongly disadvantageous only before 900 days, whereas the H haplotype is disadvantageous after 1000 days. We used a LOESS with α of 0.2 over 75-day mean haplotype mortality counts. Gray lines for comparison across sexes and with f and g.
Fig. 2 |
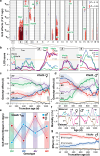
Fig. 2 |. Dynamics of Vita loci, their contributions to heritability, and source of variance.
a–f, Genetic effect plots define differences in the mean lifespan of survivorships for the four genotypes (BH, BD, CH, CD) for different categories of Vita loci. The effects of genotypes in days are marked by colored lines on the y-axis (relative difference from the average). Two-letter labels define genotypes (pairs of haplotypes). LOD scores are plotted along the bottom of each plot as a black trace above the T-age x-axis. Vita locus names are marked in all panels. Extended data 2 provides these plots for sex-combined data, females, and males. a, Vita1b has durable and relatively uniform actuarial effects that extend from T42 to T900 survivorships. The initially negative effect of the BD genotype in most survivorships is caused by higher mortality visible starting in the T855 survivorship (Results for explanation). b, Vita14b is a candidate rate of aging modulator that has its highest LOD scores in the base male survivorship at T42 that reflects a life-long and uniform contrast in mortality rates between BD and CH genotypes. All modes of display are compared for this locus in Extended Data 5, enabling readers to comparing survivorship plots with age-dependent mortality. c, Vita1c has early effects in male mortality from the infections at T365 and T590. d, Vita9c is an example of a locus with late effects after T935 due to complex sex difference (Extended Data 2q). e Vita4a has a striking reversal of genotype effects between T450 and T810—marked by three vertical gray lines in both panels—that is caused by offset waves of mortality in males: an early phase of C haplotype mortality starting at 400 days (f) and a delayed phase of H haplotype mortality starting at 560–600 days that both peak at roughly 750 to 800 days. f, Age-dependent hazard ratios for males at Vita4a. Each cross-hair point represents 80 mortality events over an age range centered on the point that are either C or B maternal haplotypes (top) or H or D paternal haplotypes. Points were smoothed using a LOESS with a span of 0.3 (Methods). g,h, Comparison of the variance explained across all survivorships specifically by peak markers. The pink boxplots (Vg) are estimates of variance that can be explained by all 29 Vita loci. The blue boxplots are similar estimates of variance explained by the subset of Vita-Vita epistatic interactions (Vgxg) defined in a larger bold font in Fig. 5b. The green boxplots (Ve) estimate the summed environmental and experimental variance further broken down in panels i and j. The orange lines are smoothed averages of the variance that we cannot explain, including gene-by-environmental effects and higher-order genetic factors such as indirect genetics effects of co-housed mice. h, Female components as above, but note the significantly lower variance values compared to males. The gray horizontal lines at 10% and 37.5% in (g) and (h) are to help compare variance levels between sexes. i,j, Breakdowns of non-genetic sources of variance. Rows labeled Drug are variance estimates of dietary supplements versus the control diet. Cohort is variance associated with year of the production of a cohort—nine years total. Site is variance attributable to differences among the three vivaria. For a display of Vg of individual Vita loci for all survivorships see Extended Data 6.
Fig. 3 |
Fig. 3 |. Antagonistic sex effects within Vita loci.
a, Overview of all significant (red) and suggestive (light blue) locus-by-sex interaction effects (G×S) across all Vita loci in all survivorships. The G×S effect on Chr 8 is most likely a real interaction of a locus that has a main effect below our threshold. The G×S values in Table 1 are more discrete and only test top markers in the most significant survivorship. b, The first four chromosomes illustrate the range of sex differences in effects of Vita loci at T365. Red and blue lines signify female and male additive genetic effects, respectively (LOD scores), whereas the thicker purple lines signify the G×S effect, and the green lines are the “unsexed” or combined additive effect. Orange line is the genome-wide significance threshold at LOD 3.95. There are no G×S effects on Chr 1 (b, left). Vita loci with significant G×S effects on chromosomes 2, 3, and 4 are highlighted in green with the T-age of peak G×S at red triangles. c,d, Vita2b has strong G×S differences that define antagonistic (or complementary) effects on the two sexes. The notable reversals in life expectancies of genotypes in d are caused by higher mortality rates of carriers of the C and H haplotypes up to about 700 days, followed by higher mortality of D and B carriers from 800 to 1100 days (vertical lines at peak morality circa 850 days). e, The G×S difference and standard error of lifespans of males and females for the four genotypes. At T365 the CH and BH genotypes are advantageous for expectancies of females but the CD and BD haplotypes for males. f, Mortality rate differences (%) as a function of age, sex, and parental haplotypes as in Fig. 1h. In females, mortality rates of D carriers peak at 650 days, whereas H carriers do not peak until 1040 days. In males the C and H haplotypes have more uniform mortality distribution across lifespan whereas B and D haplotypes have a leptokurtic distributions that peak between 700 and 1050 days. g, The hemizygous B haplotype in males at VitaXa has a 30-day positive effect on lifespan compared to the C haplotype until T300.
Fig. 4 |
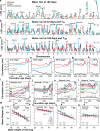
Fig. 4 |. The genetic modulation of life expectancy by body weight is stronger in males than females.
a, Conventional QTL maps of body mass (Mass loci) at 183 days for both sexes and combined. There are 25 significant Mass loci at T183 (see Extended Data 7 for all other ages). The yellow horizontal lines in a, b and c are genome-wide acceptance thresholds. The faint vertical gray lines at Mass peaks do not overlap significantly with Soma loci. b, Maps of the Soma loci that modulate correlations between body weight at 42 days and life expectancy in the T42 survivorship. Several loci are named despite being below threshold at this age or in (c). c, Corresponding Soma loci for body weight at 183 days (6 months) with life expectancy at T185. d-h, Actuarial plots for correlations of body weight at five ages (42, 183, 385, 558, and 730 days) for males and females. In d there is only a modest correlation of weight at 42 days with subsequent lifespan in any survivorship in either sex, but by 183 days in (e) there is a strong negative correlation in males and a significant sex difference (–logP of the sex difference is given above the x-axis). g, There is no sex difference at 548 days. h, Body weight at 730 days has a positive correlation in males but by the T1040 survivorship the female correlations are higher. i,j, Actuarial plots of correlations between weight at 183 days with subsequent survivorships for Soma3b for males i and females j. Correlations of the four color-coded genotypes differ significantly for males in the T365 survivorship (left orange bar) but not in the older T665 survivorship. The –logP Soma scores are given along the x-axis (black trace) with the maximum actuarial value. Note arrows from orange bars to panels m and n—cross-sectional views of these weight to life expectancy correlations at T365 that are highly significant in the T365 survivorship with a –logP of 4.8 but not significant in the T865 survivorship in n. k,l, Comparison of survivorship differences between males and females at Soma1a. Soma1a is close to the significance threshold in males in the T710 survivorship. Orange bars correspond to o and p. LOD scores (black lines) above the x-axis are significant at 2.75. Note the y-axis scale differences between sexes. m-n, Plots of Soma3b correlations (Spearman rank rho) in males in T365 and T865 survivorships. Survivorships were binned in 2-gram weight classes. The six circles sizes provide approximate sample size per class scaled to the log of the number. o,p, Comparison of male and female sex differences in Soma correlations that correspond to k and l at T365.
Fig. 5.
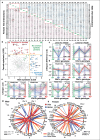
Fig. 5.. Epistasis among Vita and Soma loci.
a, A full matrix of with LOD scores of the locus-by-locus interactions in the T42 survivorship of all animals in which the upper triangular matrix tabulates male scores, the lower tabulates female scores. LODs at or above 3.8 in larger bold font (N = 22 in males, 19 in females). There is minimal commonality between male and female epistasis. Similar matrices are given for all four ages for three sex combinations—combined, females only, and males only in Supplementary Data 10. b, Correlation plot of female versus male epistasis in the T42 survivorship. Those above threshold are marked in red for females (N = 19), in blue for males (N = 21) and labeled by Vita pair numbers. There are no points significant LODs shared by both sexes in quadrant Q2. However, the green points in Q3 highlight some low-level epistatic interactions shared by both sexes. The rho correlation of male and female LOD scores is 0.32. c, A pair of effect size plots of a strong female epistatic interaction between Vita1c and Vita2b at T42 that is also highlighted with a bullseye in b. The colored columns define the four genotypes at the first locus (Vita1c) whereas the four colored lines define genotypes of at the second locus (Vita2b). The y-axis is the lifespan difference of the 16 small points in each panel. Compare polarities of female and male effects of the CD genotype (thicker blue lines)—an example of modest antagonistic epistasis. d, A male interaction between Vita1c and Vita3a highlighted by the blue bullseye in (b). There is no interaction in females (left). e, Epistatic interactions at T42 and T740. The Vita1b–Vita9a interaction illustrates the classic masking effect with all lines converging in the pink BD Vita1b column. The male effects is not significant. f, The strong Vita3a-Vita5a interaction is weak in the T42 female survivorship but strong here at T740. Point sizes vary as a function of numbers of individuals per genotype pair. Almost all points are well above N = 50. g,h, Overview of all epistatic interactions in the T42 survivorship with LODs above 3.8 (thin lines), above 4.2 (medium lines), and above 4.5 (thick lines). Similar plots of the other three older survivorships are provided in Extended Data Fig. 9. Chromosomes are labeled with abbreviated Vita and Soma symbols. Color and type of lines define partnership types. There are 78 links between males and 72 in females of all types, but only two overlap in both sexes. Extended Data 9 provides the same plots for all survivorships.
Fig. 6 |
Fig. 6 |. Genetics of Vita9b and candidate gene analysis.
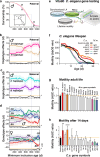
a, Kaplan-Meier plot for paternal haplotypes in male UM-HET3 mice at Vita9b. The D haplotype has a survival advantage compared to the H haplotype until 800 days (faint vertical line through panels a-e). The small KM insert box is redrawn from Jackson et al. (2002) who detected the same effect at this locus in a separate cohort (D9Mit10). b,c, Contrasting effect plots for paternal (H, D) and maternal (C, B) haplotypes along with LOD scores. Life expectancies of both H and D haplotypes invert between T250 and T900. Those of C and B haplotypes are durable. d, Corresponding genotype plots of males and females that are significant only in old survivorships. e, Design of the C. elegans motility assay in which RNAi were used to knock down expression of target transcripts with two levels of replication. f. Time course of age-related changes in motility of 6 of 15 lines—the control (black), and the daf-2 positive control (orange). Effects of RNA knockdowns on motility of 15 orthologs of Vita9b candidates in C. elegans. g, Summary of motility over most of adult life (1 to 30 days). Asterisks are significant effects with correction for multiple tests. Of the 15 genes tested, 3 reduce motility significantly— pes-4 (mouse Pcbp4), pho-6 (Acp3), and dpf-5 (Apeh). acds-10, an ortholog of the mouse Acad11 gene, improves motility relative to control and in a pattern like that of daf-2. h, Motility after 14 days of age. Only effects of daf-2 and acds-10 are significant. All values are normalized to control integrated over the age range (ratios of areas under the curve; AUC).

References

    1. Maynard Smith J. Review lectures on senescence - I. The causes of ageing. Proc. R. Soc. Lond. B. 157, 115–127 (1962). - PubMed
    1. Rose M. & Charlesworth B. A test of evolutionary theories of senescence. Nature 287, 141–142 (1980). - PubMed
    1. Gelman R., Watson A., Bronson R. & Yunis E. Murine chromosomal regions correlated with longevity. Genetics 118, 693–704 (1988). - PMC - PubMed
    1. Schächter F., Cohen D. & Kirkwood T. Prospects for the genetics of human longevity. Hum Genet 91, 519–526 (1993). - PubMed
    1. Nuzhdin S. V., Pasyukova E. G., Dilda C. L., Zeng Z. B. & Mackay T. F. Sex-specific quantitative trait loci affecting longevity in Drosophila melanogaster. Proc Natl Acad Sci U S A 94, 9734–9739 (1997). - PMC - PubMed

Publication types

LinkOut - more resources