[Preprint]. 2025 Jul 27:2025.07.26.666966.
doi: 10.1101/2025.07.26.666966.

Bacterial metabolites induce cell wall remodeling, antifungal resistance, and immune recognition of commensal fungi

Affiliations

Bacterial metabolites induce cell wall remodeling, antifungal resistance, and immune recognition of commensal fungi

Faith Anderson Davis et al. bioRxiv. .

Abstract

The fungus Candida albicans commensally colonizes mucosal surfaces in healthy individuals but can cause both superficial mucosal and life-threatening disseminated infections. The balance between commensalism and pathogenicity is complex and depends on factors including host and fungal genetic background, the host environment, and fungal interactions with local microbes. The major interaction interface of C. albicans with the host is its multilayered cell wall, which is dynamic and highly responsive to the surrounding environment. Therefore, factors that influence the fungal cell wall will directly impact C. albicans-host interactions. Our work demonstrates that multiple physiologically-relevant gastrointestinal bacteria influence fungal cell wall composition during co-culture with C. albicans, including as complex communities derived from the gut. Using Escherichia coli as a model, we show that bacterial-induced fungal cell wall remodeling occurs rapidly and is mediated by secreted bacterial metabolite(s). Fungal mutant analysis revealed that the high osmolarity glycerol (HOG) pathway, which is critical for responding to environmental stresses, has an important role in regulating this cell wall remodeling phenotype through the Sln1 histidine kinase. Importantly, bacterial-mediated fungal cell wall remodeling increases C. albicans resistance to the echinocandins, increases recognition by both dectin-1 and dectin-2, and decreases recognition by human IgA. Overall, this work comprehensively characterizes an interaction between C. albicans and common gastrointestinal bacteria that has important implications for fungal biology and host interactions.


Figures
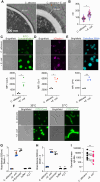
Figure 1:
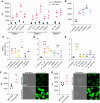
Figure 1:. Candida albicans undergoes cell wall remodeling during co-culture with Escherichia coli with an impact on immune recognition.
A) Representative transmission electron micrographs (TEMs) of C. albicans grown for 24 hours in monoculture (left) or co-culture with E. coli (right). White bars mark the outer mannan layer. 10,000x magnification. B) Quantification of mannan fibril length from TEMs across 3 biological replicates. Large outlined symbols represent the average of each biological replicate while the smaller symbols represent technical replicates. Significance determined by paired t-test on biological replicates. C, D, E) Determination of C. albicans cell wall mannan (C), exposed β−1,3-glucan (D), and chitin (E) following 24-hour co-culture with E. coli. Representative brightfield and fluorescent microscopy images (top). 100x magnification. Flow cytometric quantification of cell wall component (bottom). Cell wall mannan stained with FITC-Concanavalin A (ConA), exposed β−1,3-glucan stained with hDectin-1a and anti-IgG antibody conjugated with Alexa Fluor 647 (Dc-1), chitin stained with Calcofluor White (CFW). Gating strategy is illustrated in SFig 4A. Significance determined by paired t-test. MFI = mean fluorescence intensity. (F) Representative fluorescent microscopy images of C. albicans grown in monoculture or co-culture with E. coli at 30°C or 37°C. G, H) Engagement of Dectin-1 (G) or Dectin-2 (H) with C. albicans grown in monoculture or co-culture with E. coli. D-Zymosan and furfurman represent positive controls for each receptor. Large, outlined symbols represent the average of each biological replicate while the smaller symbols represent technical replicates. Significance determined by one-way ANOVA with Dunnett’s multiple comparison test. I) Human fecal IgA binding to C. albicans grown in monoculture or co-culture with E. coli. Significance determined by Wilcoxon test.
Figure 2:
Figure 2:. Composition of rigid and mobile polysaccharides probed by high-resolution ssNMR.
A) Overlay of 13C cross-polarization (CP) spectra representing rigid glucans for C. albicans monoculture in pink and C. albicans + E. coli co-culture in blue. Spectra were normalized by β−1,3-glucan carbon 3 (B3; 86 ppm) peak, as indicated by the star. B) 2D 13C-13C CORD correlation spectrum resolving the signals of β−1,3-glucan, β−1,6-glucan, and chitin in the rigid cell walls of monoculture in pink and co-culture in blue. C) Molar composition of the rigid components as determined by analyzing peak volumes in 2D 13C-13C CORD spectra. Glucan types and their corresponding carbon signals are abbreviated and color-coded as follows: β−1,3-glucan (B, blue), Chitin (Ch, orange) and Mannan (Mn, light brown). D) Overlay of two direct polarization (DP) spectra measured with 2 s recycle delays representing mobile glucans for C. albicans monoculture in pink and C. albicans + E. coli co-culture in blue. E) Overlay of two 2D 13C refocused J-INADEQUATE spectra of C. albicans monoculture in pink and co-culture in blue, with assignments linking monomers to spectral peaks. F) Molar composition of these mobile components was determined by analyzing peak volumes in 2D 13C refocused J-INADEQUATE spectra.
Figure 3:
Figure 3:. Cell wall remodeling in response to bacteria is broadly conserved.
A) Flow cytometric quantification of cell wall mannan content of the indicated C. albicans isolates in monoculture or co-culture with E. coli after 24 hours. Significance determined by paired t-tests of each isolate during monoculture vs co-culture. B) Flow cytometric quantification of cell wall mannan content of C. albicans SC5314 following 24 hours of co-culture with the indicated E. coli strains. Significance determined by one-way ANOVA with Dunnett’s multiple comparison test. C) Relative change in cell wall mannan content of the indicated Candida species after 24 hours of co-culture with E. coli. Significance determined by paired t-tests of each Candida species during monoculture or co-culture with E. coli. D, E) Relative change in cell wall mannan content of C. albicans following 24 hours of aerobic (D) or anaerobic (E) bacterial co-culture. Significance determined by one-way ANOVA with Dunnett’s multiple comparison test. F, G) Flow cytometric quantification (left) and fluorescent microscopy (right) of cell wall mannan content after 24 hours of growth in germ-free or conventional mouse feces, at 37°C under aerobic (F) or anaerobic (G) conditions. Significance determined by unpaired t-test.
Figure 4:
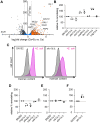
Figure 4:. Mutants in the high osmolarity glycerol cascade are defective at remodeling in response to E. coli co-cure.
A) Volcano plot of C. albicans differentially expressed genes during co-culture with E. coli compared to monoculture 6 hours after the initiation of co-culture. Dotted lines represent significance thresholds. Colored points are genes annotated as ‘carbohydrate transport’ by g:Profiler. Orange plots are significantly upregulated and blue dots are not. B) Relative amount of remodeling, based on change in cell wall mannan content, following 24 hours of co-culture with E. coli for each indicated mutant strain from the Homann collection. Set relative to cell wall remodeling of parental strain, SN152. Each point is an average of two biological replicates of one independent deletion clone. Significance determined by one-way ANOVA wit’ Dunnett’s multiple comparison test. C) Flow cytometric histograms representing cell wall mannan content of SN152 (left) or sko1Δ/Δ (right) during monoculture (grey) or E. coli co-culture (pink). D, E) Relative amount of remodeling, based on change in cell wall mannan content, following 24 hours of co-culture with E. coli for each indicated mutant strain from the Noble collection. Set relative to cell wall remodeling of parental strain, SN250. Each point is an average of two biological replicates of an independent deletion clone. Significance determined by one-way ANOVA with Dunnett’s multiple comparison test. F) Relative amount of remodeling, based on change in cell wall mannan content, following 24 hours of co-culture with E. coli for sln1Δ/Δ. Set relative to SC5314. Significance determined by unpaired t-test.
Figure 5:
Figure 5:. E. coli-induced fungal cell wall remodeling is mediated by a secreted metabolite.
A) Flow cytometric quantification of cell wall mannan content over a 6-hour time course of C. albicans grown alone or in co-culture with E. coli. C. albicans was grown to mid-log phase before the addition of YPD media with or without E. coli. Significance determined by paired t-tests at each time point. B) Relative change in cell wall mannan content of C. albicans grown alone or co-cultured with live or heat-killed E. coli for 24 hours. Significance determined by one-way ANOVA with Dunnett’s multiple comparison test. C) Relative change in cell wall mannan content of C. albicans grown alone, with live E. coli, with E. coli-conditioned YPD, with boiled E. coli-conditioned YPD, or with E. coli-conditioned YPD with 2% glucose for 6 hours. Significance determined by one-way ANOVA with Dunnett’s multiple comparison test. D) Relative change in cell wall mannan content of C. albicans grown alone YPD, in E. coli-conditioned YPD, or in YPD supplemented with 1% of either acetate, butyrate, citrate, or lactate for 6 hours. Significance determined by one-way ANOVA wit’ Dunnett’s multiple comparison test. E) Relative change in cell wall mannan content of C. albicans grown alone in YPD, in conditioned YPD from indicated bacterial species, in 0.25M NaCl YPD, or in 0.5M sorbitol YPD for 6 hours. Significance determined by one-way ANOVA with Dunnett’s multiple comparison test. F) Linear regression comparing relative magnitude of remodeling content and osmolality of media from previous panel.
Fig. 6.
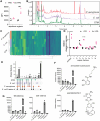
Fig. 6.. Metabolomics analysis identified secreted metabolites present in bacterial cultures that induce cell wall remodeling.
A) Flow cytometric quantification of C. albicans cell wall mannan content after 6 hours of growth in YPD with 50 mg/mL of aqueous and organic extracts from YPD or Ec-YPD. Significance determined by two-way ANOVA with Sidak’s multiple comparison test. B) Base peak chromatograms (BPCs) of organic extracts from P. aeruginosa, E. coli, and STM as analyzed via liquid chromatography-tandem mass spectrometry (LC-MS/MS). C) Heatmap of LC-MS/MS data for triplicate injections of the three organic extracts of each bacterial supernatant. D) Relative change in cell wall mannan content for C. albicans grown in organic fractions of YPD or Ec-YPD, normalized to unfractionated YPD control. Tested concentrations of organic fractions are as follows: fraction 1, YPD 10 mg/mL, Ec-YPD 10 mg/mL; fraction 2, YPD 10 mg/mL, Ec-YPD 10 mg/mL; fraction 13 YPD 10 mg/mL, Ec-YPD 10 mg/mL; fraction 4, YPD 2 mg/mL, Ec-YPD 10 mg/mL; fraction 5, YPD 2 mg/mL, Ec-YPD 2 mg/mL; fraction 6, YPD 10 mg/mL, Ec-YPD 0.5 mg/mL; fraction 7, YPD 0.5 mg/mL, Ec-YPD 2 mg/mL; fraction 8, YPD 0.5 mg/mL, Ec-YPD 0.5 mg/mL. Significance determined by two-way ANOVA with Sidak’s multiple comparison test. E) Upset plot of metabolomics features shared between the three biologically active bacteria as well as the active fraction 4 from Ec-YPD. F) Two of the 22 shared features from (E) that followed abundance patterns that match their biological activity. These were putatively annotated as aminochelin and guanipiperazine A. G) Examples of unannotated shared features from (E) that followed the expected abundance patterns.
Figure 7:
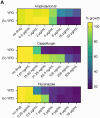
Figure 7:. Bacterial-induced fungal cell wall remodeling alters antifungal resistance.
Minimum inhibitory concentration (MIC) assay for C. albicans grown in YPD or Ec-YPD and treated with increasing concentrations of amphotericin B, caspofungin, and fluconazole.

Similar articles

References

    1. Nash A. K. et al. The gut mycobiome of the Human Microbiome Project healthy cohort. Microbiome 5, 153 (2017). - PMC - PubMed
    1. Lionakis M. S. & Netea M. G. Candida and host determinants of susceptibility to invasive candidiasis. PLoS Pathog. 9, e1003079 (2013). - PMC - PubMed
    1. Neville B. A., d’Enfert C. & Bougnoux M.-E. Candida albicans commensalism in the gastrointestinal tract. FEMS Yeast Res. 15, (2015). - PubMed
    1. Puel A. Human inborn errors of immunity underlying superficial or invasive candidiasis. Hum. Genet. 139, 1011–1022 (2020). - PMC - PubMed
    1. Fan D. et al. Activation of HIF-1α and LL-37 by commensal bacteria inhibits Candida albicans colonization. Nat. Med. 21, 808–814 (2015). - PMC - PubMed

Publication types

LinkOut - more resources