[Preprint]. 2025 Jul 23:2022.10.14.512297.
doi: 10.1101/2022.10.14.512297.

Transitory Schwann Cell Precursor and hybrid states underpin melanoma therapy resistance and metastasis

Affiliations

Transitory Schwann Cell Precursor and hybrid states underpin melanoma therapy resistance and metastasis

Vishaka Gopalan et al. bioRxiv. .

Abstract

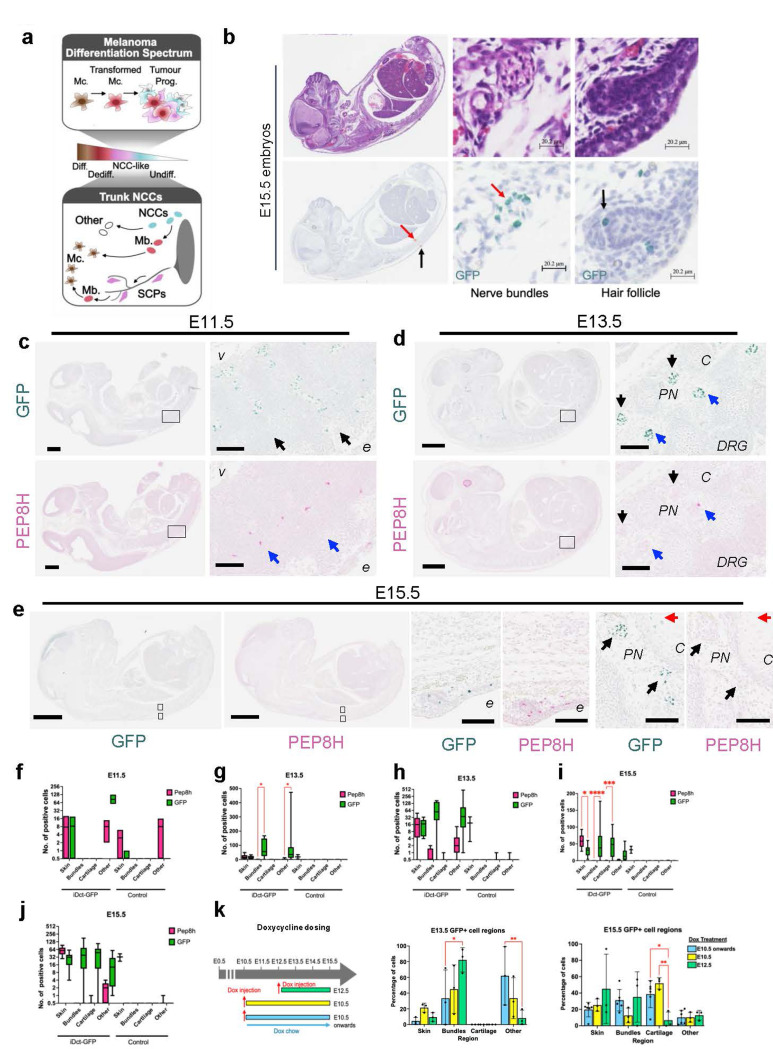
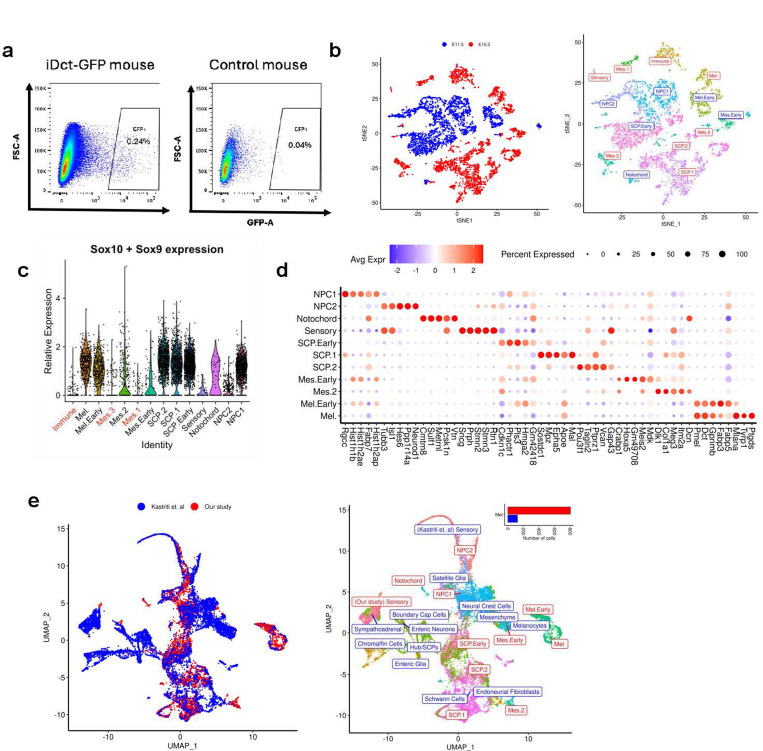
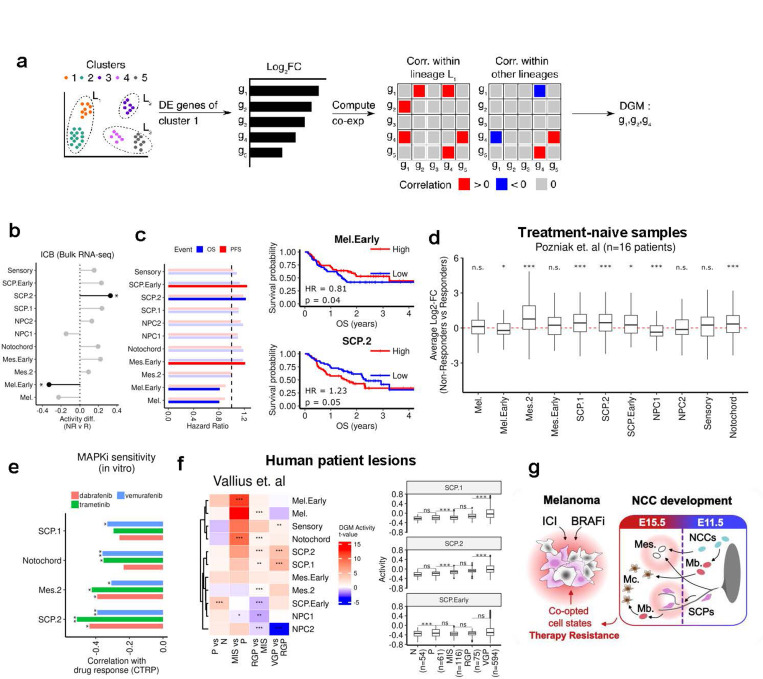
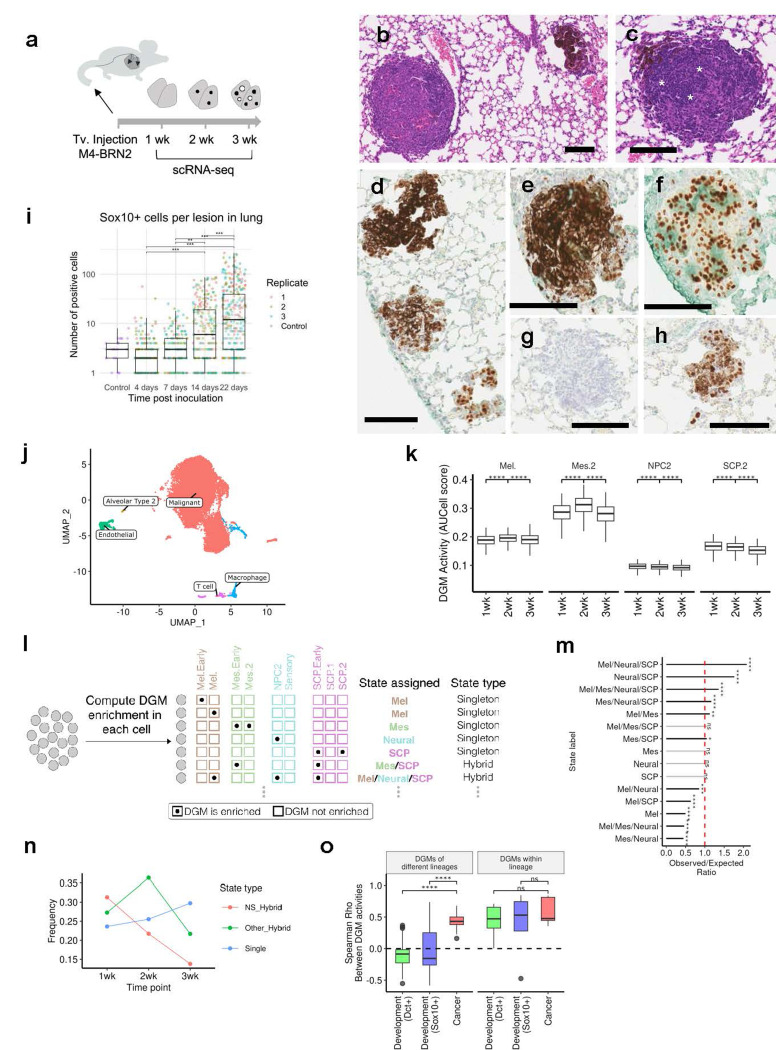
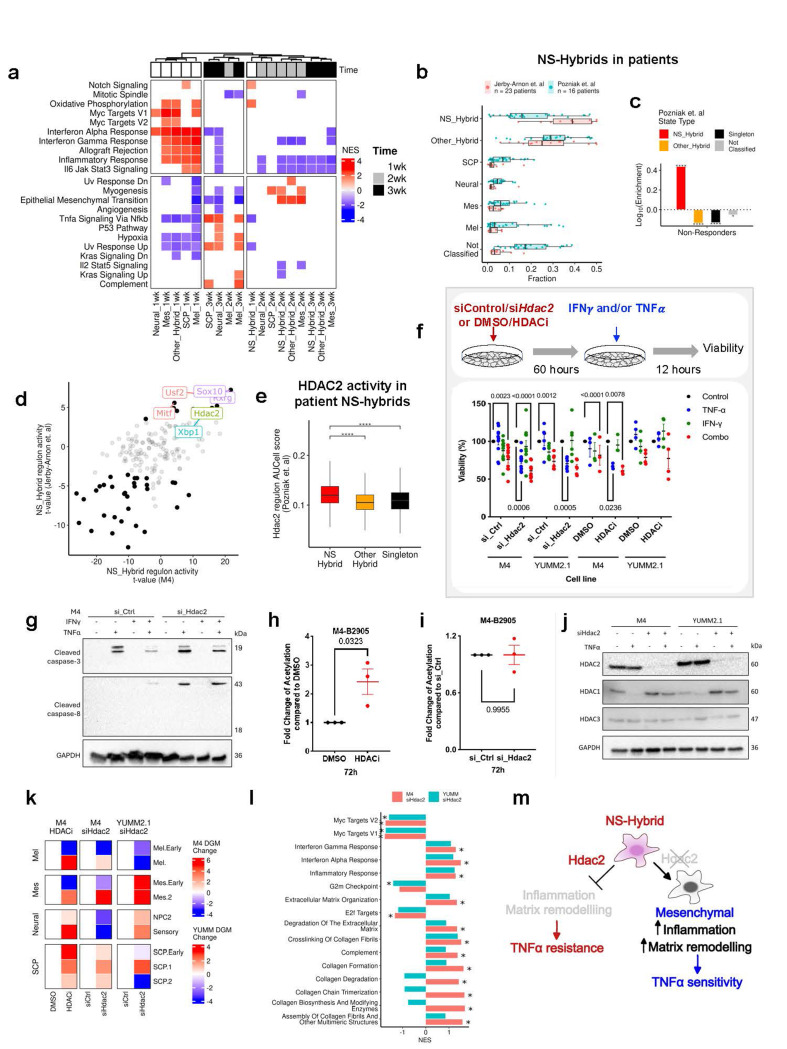
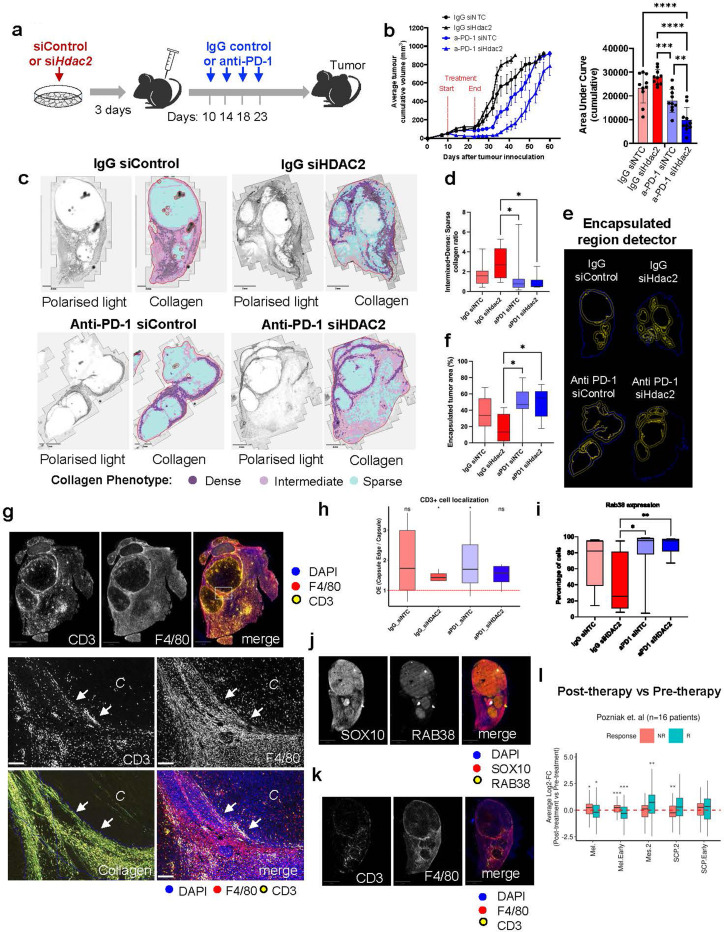
Melanoma plasticity, driven by phenotype state switching, underlies clinically relevant traits such as metastasis and therapy resistance. As melanoma progression is thought to recapitulate aspects of neural crest cell (NCC) development, understanding embryonic melanocyte specification and lineage fate decisions of closely related NCCs may illuminate the pathways co-opted during disease evolution. Here, we use a mouse model to isolate and sequence Dopachrome tautomerase (Dct) expressing NCCs, the precursors of melanocytes, at two key developmental stages. We classify these lineages and devise a Developmental Gene Module (DGM) scoring system to interrogate lineage state switching in melanoma samples. In bulk transcriptomes, activation of DGMs representing embryonic Schwann Cell Precursors (SCPs)-multipotent stem cells-in patient tumors predicts poor response to immune checkpoint inhibitors (ICI). Co-activation of SCP and Mesenchymal-like (Mes.) modules further correlates with resistance to MAPK inhibitors. Notably, single-cell analyses reveal that melanoma cells can simultaneously express multiple DGMs, forming "hybrid" states. Cells in a hybrid Neural/SCP state are enriched in early metastasis and ICI-resistant tumors and are insensitive to inflammatory stimuli. We demonstrate that targeting Hdac2, a histone deacetylase associated with this Neural/SCP hybrid state, promotes a mesenchymal-like state switch, remodels the tumor microenvironment, and sensitizes melanoma cells to TNFα and tumors to ICI therapy. Our methodology thus reveals dynamic patterns of lineage state switching correlated with melanoma tumor evolution to drive insight into new therapeutic targets.


Conflict of interest statement

Conflicts of Interest The authors declare no conflicts of interest.

Figures

Figure 1.
Figure 1.. iDct-GFP reporter labels nerve-associated, migrating, and cutaneous embryonic NCCs.
(a) Schematic of the concept of the paper. As melanomas form and progress, they dedifferentiate with cell states that represent a spectrum of dedifferentiation statuses. We hypothesize these states have parallels in normal trunk NCC development. NCCs, Neural Crest Cells; Mc., Melanocytes; Tumor Prog., tumors Progression; Diff., Differentiated; Dediff., Dedifferentiated; Undiff., Undifferentiated; Mb., Melanoblasts; SCPs, Schwann Cell Precursors. (b) Sagittal sections of E15.5 iDct-GFP embryos. Top panels, Hematoxylin and eosin (H&E); Bottom panels, anti-GFP antibody (vina green). Black arrow, hair follicle; Red arrow, peripheral nerve bundle. Scale bars, 20.2μm (c-e), Anti-GFP (vina green) and Anti-PEP8H (magenta) staining of iDct-GFP embryos. e, epidermis; v, ventral; C, cartilage; PN, peripheral nerve; DRG, dorsal root ganglion. (c) Black arrows, GFP+ nerve tracks; blue arrows, PEP8H+ nerve tracks. (d-e) Blue arrows, GFP+/PEP8H+ nerve bundles. Black arrows, GFP+/PEP8H- nerve bundles. (e) Red arrow, weak GFP staining in cartilage. Scale bars, E11.5, 500 μm embryo, 100 μm zoom; E13.5, 800 μm embryo, 100 μm zoom; E15.5, 2 mm embryo, 100 μm zoom. (f-j) Counts of GFP+ cells and PEP8H+ cells in serial sections across embryos of different stages. (f, h, j) Log scaled. (k) Different doxycycline dosing schedules for staged activation of the iDct-GFP transgene. Red arrows, one dose intraperitoneal injection of doxycycline. Blue horizontal arrow, continuous dosing through doxycycline chow. Bar graphs of the proportion of GFP+ cells in different anatomical regions at E13.5 (left-hand graph) and E15.5 (right-hand graph). (g, i, k) Significance determined by two-way ANOVA, with Šídák’s multiple comparison test (g-i), with Tukey’s multiple comparison test (k); *, adjusted P-value < 0.05; **, adjusted P-value < 0.01; ***, adjusted P-value < 0.001; ****, adjusted P-value < 0.0001.
Figure 2.
Figure 2.. ScRNA-seq uncovers diverse subpopulations of mammalian melanoblasts with distinct phenotypes.
(a) Fluorescence-Activated Cell Sorting of GFP+ cells from doxycycline-induced Dct-rtTA:TRE-H2B-GFP (iDct-GFP) embryos compared to TRE-H2B-GFP one allele control embryos. (b) tSNE embedding of GFP+ scRNA-seq data (10x Genomics). (c) Violin plot of cumulative Sox10 and Sox9 relative expression levels. Clusters labeled in red were removed from the study. (d) Dot plot of the top 5 differentially upregulated genes in each cluster. (e) Co-embedded UMAP plot of our data (red) and Kastriti et al. NCC data (blue). Right panel shows individual clusters. Inset shows enrichment of melanocytes in our study (red) compared to the Kastriti et al. study (blue). DGM, Developmental Gene Module; Mel., Melanocytic; Mes., Mesenchymal-like; NPC, Neural Progenitor Cell; SCP, Schwann Cell Precursor.
Figure 3.
Figure 3.. A SCP-like melanoma cell state is associated with immune exclusion in patient tumors and therapy resistance.
(a) Procedure to derive DGMs from differentially expressed genes of Dct+ neural crest clusters belonging to different lineages. (b) Coefficient of linear mixed model fit (with patient cohort as random effect) of DGM activity compared to response status, where a positive value indicates higher activity in non-responders. Significance determined by t-test, * indicates p-values < 0.05. NR, Non-Responder; R, Responder. (c) Left: Hazard ratio of DGM activity in progression-free survival (PFS, red) and overall survival (OS, blue) of ICI therapy from Cox mixed effects regression (with cohort as a random effect) across multiple cohorts. Hazard ratios greater than 1 are positively associated with poor survival. Right: Kaplan-Meier curves of overall survival of multiple ICI cohorts[–49], patients stratified by DGM activity. (d), Log2 Fold-change of DGM genes in melanoma cells before treatment from non-responders compared to responders in Pozniak et al. scRNA-seq data. Significance determined by Wilcoxon two-sided test, **** indicates p < 10−4, *** p < 10−3, ** p < 0.01, * p < 0.05 (e) Spearman correlation between area above drug response curve of indicated drugs across CCLE cell lines and DGM scores in bulk RNA-seq of these cell lines. Negative correlation implies that high DGM activity corresponds to lower drug-induced cell death. Significance determined by bootstrap test, * indicates p-values < 0.05. (f) Left: t-values of DGM activities from linear model analysis of P vs N, MIS vs P, RGP vs MIS, and VGP vs RGP stages of melanoma in GeoMx data from Vallius et al. melanoma microregions. Right: Boxplots of DGM activities across stages of melanoma progression, with the number in brackets indicating the number of microregions. Significance determined by t-test from linear mixed model with patient ID as random effect, **** indicates p < 10−4, *** p < 10−3, ** p < 0.01, * p < 0.05. N, Normal; P, Precursor; MIS, Melanoma in situ; RGP, Radial Growth Phase; VGP, Vertical Growth Phase. (g) Schematic to illustrate common cell states co-opted by melanoma cells and their equivalent cell state from embryonic development. Red highlighted regions depict two cell types in embryonic day (E) 15.5, Schwann Cell Precursors (SCPs) and Mesenchymal-like (Mes) that are co-opted in Immune Checkpoint Inhibitor (ICI) and targeted therapy (BRAFi) resistance. NCCs, Neural Crest Cells; Mb., Melanoblasts; Mc., Melanocytes.
Figure 4.
Figure 4.. scRNA-seq uncovers dynamic DGM evolution during metastatic outgrowth.
(a) Schematic of experimental setup. (b-h) Characterization of multiple pulmonary metastatic phenotypes from two-week to 22-day post-tail vein injection of M4-BRN2 mouse melanoma cells, representative examples. Bars = 100 μm. (b-c) Melanotic and amelanotic lesions, H&E stain. (c), Heterogeneous lesions with both pigmented and nonpigmented neoplastic cells and a component of tumor-infiltrating lymphocytes (*). (d-h) Anti-SOX10 immunohistochemistry reveals a heterogeneous pattern of nuclear immunolabeling, including some but not all lesions. (d) Example metastatic nodules range from intensely pigmented to heterogeneous mixtures of pigmented and nonpigmented tumor cells in some nodules (middle lesion), and relatively amelanotic nodules with distinct anti-SOX10 positive nuclei (lower nodule). (e-f) The same tumor nodule in serial sections is represented after anti-SOX10 without (e) and with (f) melanin bleaching to remove pigment. (g-h) Metastatic pulmonary nodules from the same lung section, revealing anti-SOX10 negative (f) and immunopositive (g) lesions. (i) Automated quantitation (QuPath) of Sox10+ lesions across timepoints. Significance determined by ANOVA, with Tukey’s multiple comparison test; *, adjusted P-value < 0.05; **, adjusted P-value < 0.01; ***, adjusted P-value < 0.001. (j) UMAP of all cells across all time-points obtained after batch correction and integration using Seurat. (k) AUCell scores of Mel., Mes.2, NPC2, and SCP.2 DGMs are all malignant cells at each time-point post inoculation. **** p < 10−4, *** p < 10−3, ** p < 0.01, * p < 0.05, two-sided Wilcoxon test. (l) Schematic representation of hybrid state mapping. (m) Ratio of observed frequency of hybrid states compared to statistical expectation by random chance in M4 cells. **** p < 10−4, *** p < 10−3, ** p < 0.01, * p < 0.05, see Methods for test details (n), Frequency of melanoma hybrid states at 1-, 2-, and 3-weeks post lung colonization during metastasis (o) Spearman’s Rho correlation score of expression of activities between DGMs of different lineages (left-hand panel), or within the same lineage (right-hand panel) across developmental datasets (Dct+, this paper) and (Sox10+, Kastriti et al., 2022) or M4 B2905 cells (this paper). **** p < 10−4, permutation test (k-o) Mel, Melanocytic; Mes, Mesenchymal-like; NPC, Neural Progenitor Cell; NT, Notochord; SCP, Schwann Cell Precursor.
Figure 5.
Figure 5.. An anti-inflammatory hybrid state subtype is associated with non-response to therapy and regulated by Hdac2, which protects against TNFα-mediated cell death.
(a) Gene Set Enrichment Analysis across hybrid and singleton states in M4-BRN2 melanoma cells during lung colonization. (b) Fraction of cells in each tumor from Pozniak et al., 2024, and Jerby-Arnon et al., 2018 cohorts. (c) Enrichment of hybrid and singleton states in treatment-naive responder and non-responder melanoma patients from Pozniak et al., 2024. **** p < 10−4, Fisher exact test (d) Regression t-values of SCENIC-inferred regulon activities in NS-hybrid cells in both mouse (M4 - this study, x-axis) and human (Jerby Arnon et al., y-axis) melanomas. Top regulons are highlighted with the colors indicating the development lineages in which regulons are specifically active (Teal: No lineage specificity, Green: Neural, Purple: SCP, Red: Mel). (e) HDAC2 regulon activities in treatment-naive tumor cells of the Pozniak et al. dataset. **** p < 10−4, two-sided Wilcoxon test (f) 72-hour siRNA knockdown or HDACi (0.5μm) treated cells, co-treated in the last 12 hours with cytokines, TNFα (200 ng/mL), IFNγ (1000 U/mL), or a combination of both. Percentage viability relative to siControl or DMSO control wells. Significant P-values indicated, One-way ANOVA. (g) Western blot of cleaved caspase-3 and cleaved caspase-8 protein in B2905 melanoma cells, treatments indicated. (h-i) Relative acetylation levels of HDACi-treated (h) and Hdac2 knockdown (i) mouse melanoma cells (B2905). (j), Western blot of HDAC1, HDAC2 and HDAC3 protein levels across mouse melanoma cell lines and treatments. (k) DGM activity change across HDACi and siHdac2-treated mouse melanoma cells with activities in DMSO or siControl (respectively) used as a baseline for z-score calculations. (l) GSEA analysis of Hallmark pathways and Reactome pathways in Hdac2 knockdown in mouse melanoma cell lines. NES: Normalized Enrichment Score. * Benjamini-Hochberg adjusted p < 0.05, permutation test (m) Schematic of hypotheses based on these findings. (f-l) si_Ctrl, non-targeting control siRNA; si_Hdac2, Hdac2 targeting siRNA; HDACi, HDAC inhibitor, entinostat.
Figure 6.
Figure 6.. HDAC2 Loss reprograms the melanoma microenvironment to re-sensitize tumors to anti-PD-1 therapy.
(a) Schematic of treatment schedule. (b) Left: Tumor growth curves, treatment indicated. Right: cumulative Area Under Curve extrapolated from tumor growth curves. (c) Left-hand panels, Optical density sum projected image of picrosirius red stained tumor sections visualized under polarized light. Right-hand panels, Qupath AI-generated detection of sparse, intermediate, and medium collagen densities based on the optical density sum images. (d) Ratio of tumor area comprised of dense/intermediate collagen versus sparse collagen. (e) Example of regions identified by the automated capsule analysis algorithm (Qupath). (f) Proportion of tumor area encapsulated. (g) Tissue sections stained with anti-CD3 and anti-F4/80 alongside a picrosirius red stain of a serial section visualized in polarized light (Collagen). C, Capsule; arrows, edge regions of high CD3+ cells, high F4/80+ cells alongside collagen fibrils. (h) Fold change of proportion of tumor CD3+ cells at the capsule edge/ in the capsule. (i) Percentage of Rab38+ cells per tumor per treatment. (j) Immunostaining of tumors with anti-RAB38 and anti-SOX10 antibodies. (k) Immunostaining of tumors with anti-F4/80 and anti-CD3 antibodies. (l) Log2 Fold-change of DGM genes in melanoma cells of post-treatment cells compared to pre-treatment cells amongst responders and non-responders in Pozniak et al. scRNA-seq data. (d, f) Kruskal Wallis test, (h) two-sided Wilcoxon test, (b, i) One-way ANOVA, Tukey’s multiple comparison test; *, p< 0.05; ** p < 0.01, *** p<0.001, ****p<0.0001. (l) two-sided Wilcoxon test; **** p < 10−4, *** p < 10−3, ** p < 0.01, * p < 0.05. (f-l) M4, B2905 mouse melanoma cells.

Similar articles

References

    1. Belote R.L., et al. , Human melanocyte development and melanoma dedifferentiation at single-cell resolution. Nat Cell Biol, 2021. 23(9): p. 1035–1047. - PubMed
    1. Karras P., et al. , A cellular hierarchy in melanoma uncouples growth and metastasis. Nature, 2022. 610(7930): p. 190–198. - PMC - PubMed
    1. Lu Y., et al. , ALDH1A3-acetaldehyde metabolism potentiates transcriptional heterogeneity in melanoma. Cell Rep, 2024. 43(7): p. 114406. - PMC - PubMed
    1. Marie K.L., et al. , Melanoblast transcriptome analysis reveals pathways promoting melanoma metastasis. Nat Commun, 2020. 11(1): p. 333. - PMC - PubMed
    1. Rambow F., et al. , Toward Minimal Residual Disease-Directed Therapy in Melanoma. Cell, 2018. 174(4): p. 843–855 e19. - PubMed

Publication types