[Preprint]. 2025 Jul 21:2025.07.16.665228.
doi: 10.1101/2025.07.16.665228.

Calyculin A Induces Premature Chromosome Condensation and Chromatin Compaction in G1-Phase HeLa Cells without Histone H1 Phosphorylation

Affiliations

Calyculin A Induces Premature Chromosome Condensation and Chromatin Compaction in G1-Phase HeLa Cells without Histone H1 Phosphorylation

Natalia Y Kochanova et al. bioRxiv. .

Abstract

We show here that treatment of HeLa cells with calyculin A, an inhibitor of Protein Phosphatases 1 and 2A, induces premature chromosome condensation (PCC) at any point in interphase of the cell cycle. Chromosomes in G1-phase PCC closely resemble metaphase chromatids in the light microscope, and measurements using FLIM-FRET show that they have the same level of chromatin compaction as metaphase chromosomes. However, histone H1 is not phosphorylated in G1- or early S-phase PCC. These results suggest that H1 phosphorylation is not required for mitotic chromosome condensation and chromatin compaction. They also confirm that Cdk1/cyclin B, which directly phosphorylates histone H1, is not active in G1 and thus is not essential for G1-PCC. We suggest that induction of G1-PCC involves protein kinases or other factors that are either held in an inactive state by protein phosphatases, or constitutively active but countered by phosphatases. The same factors may be involved in the onset of normal mitosis, becoming active when protein phosphatases are downregulated. Induction of PCC with calyculin A should provide a useful system for identifying and studying the biochemical pathways that are required for mitotic chromosome compaction, nuclear envelope breakdown, and other events of mitosis.


Figures
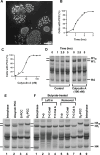
Fig. 1.
Fig. 1.
Induction of premature chromosome condensation (PCC) with calyculin A and analysis of histone H1 phosphorylation. (A) Micrograph of unsynchronized HeLa cells, spread and stained with DAPI, after 3 hrs treatment with 100 nM calyculin A. Some cells show condensed chromosomes (G1- and G2-PCC) and others show “pulverized chromosomes” (S-PCC). No interphase nuclei are seen. Scale bar represents 25 μm. (B) Percentage of unsynchronized HeLa cells displaying PCC as a function of the time of treatment with 200 nM calyculin A. (C) Percentage of unsynchronized cells displaying PCC after 3 hrs treatment with various concentrations of calyculin A. (D) Acid-urea gel electrophoresis of histones extracted from unsynchronized cells treated with 0.25 µg/mL nocodazole alone (control, left panel) or with both nocodazole and 200 nM calyculin A (right panel). H1M and H1I indicate the positions of mitotic (phosphorylated) and interphase histone H1, respectively. After 5 hrs with calyculin A, nearly 100% of cells exhibit PCC, but only some contain H1M. In this and subsequent figures, only the gel portions containing the histones are shown. (E), (F) Acid-urea gel electrophoresis of histones in PCC induced by treatment with 100 nM calyculin A for 3 hrs. (E) Histone H1 is unphosphorylated in interphase cells (lane 1). H1 phosphorylation is only partial in PCC induced in unsynchronized cells (lane 2), nearly complete in S-phase PCC (lane 3), and complete in G2-phase PCC (lane 4). (F) Histone H1 is not phosphorylated in G1-phase PCC. Cells were blocked in G1-phase by treatment with 5 mM sodium butyrate for 20 hrs, after which the butyrate was either left in (lanes 2–4) or removed by pelleting and washing the cells (lanes 5–7) before starting the calyculin A treatment. Histones were extracted at the start (T=0), after further incubation of the cells without treatment for 3 hrs (T=3 Ctrl), or after treatment for 3 hrs with 100 nM calyculin A (T=3 CalA).
Fig. 2.
Fig. 2.
Histone H1 phosphorylation is not observed in HeLa PCC until the cells have progressed at least four hours into S-phase. (A) Cells synchronized in G1-phase by butyrate treatment and then released at T=0 hrs were treated with either 2.5 mM thymidine or 0.25 µg/mL nocodazole. At intervals of 4 hrs mitotic indices were determined: nocodazole-treated culture (∆─∆); thymidine-treated culture (○─○). Also at 4 hr intervals, aliquots were treated for 4 hrs with 100 nM calyculin A, and the percentage of cells in S-phase was determined as the percentage displaying “pulverized chromosomes”: nocodazole-treated culture (▲─▲); thymidine-treated culture (●─●). (B) Analysis of histones from the thymidine-treated culture, taken at the times shown. (C) Analysis of histones from the nocodazole-treated culture, taken at the times shown. Gel samples from T=4 to T=20 hrs are from culture aliquots treated 4 hrs with calyculin A, and for these T indicates the time (hrs) at which the calyculin A treatment was started. Samples labeled T=0, T=24 and T=31 were taken at those times (hrs) from cells that were not treated with calyculin A. Histones were extracted from chromosomes or nuclei with 0.2 M H2SO4 and separated on acid-urea gels.
Fig. 3.
Fig. 3.
Roscovitine treatment of metaphase-arrested HeLa cells induces exit from mitosis and subsequent calyculin A treatment induces G1-PCC with single chromatids and no histone H1 phosphorylation. (A) The “mitotic index” (percentage of cells with condensed chromosomes and no nuclear envelopes) as a function of time after various treatments. Aliquots of a metaphase-arrested culture (mitotic index, 96%) were either incubated with no treatment (○‐‐‑○) or treated with 200 µM roscovitine for 50 min (●··─··●). At T=50 min, roscovitine was removed from the treated cells, some of which were incubated without further treatment until T=150 min (Δ···∆) while others were treated with 100 nM calyculin A at T=85 min to induce PCC (▲—▲); (B) Histones extracted from samples in (A) and analyzed by acid-urea gel electrophoresis: Metaphase-arrested cells at T=0 min (lane 1); cells at T=50 min after roscovitine treatment (lane 2); cells after roscovitine removal and further incubation until T=150 min (lane 3); and cells after roscovitine removal, treatment with calyculin A at T=85 min, and further incubation until T=150 min (lane 4). (C-H) Examples of fixed cells examined by fluorescence microscopy with DAPI stain. (C, D) Metaphase-arrested cells at T=0 min corresponding to Panel B, lane 1. The condensed chromosomes consist of paired chromatids. (E, F) Cells at T=50 min after treatment with 200 µM roscovitine, corresponding to Panel B, lane 2. Chromosomes have decondensed and nuclear envelopes have reassembled. (G, H) Roscovitine-treated cells (as in E and F) that were pelleted, washed, resuspended in fresh medium and treated with calyculin A, corresponding to Panel B, lane 4. The condensed chromosomes (G1-PCCs) consist of single chromatids and lack histone H1 phosphorylation. Scale bars represent 5 µm.
Fig. 4.
Fig. 4.
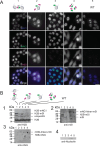
Characterization of cell lines used for FLIM-FRET. (A) Fluorescence images of the cell lines used for FLIM-FRET, expressing (1) H2B-mNeonGreen and mScarlet-I-H2B; (2) H2B-mNeonGreen and free mScarlet-I; (3) H2B-mNeonGreen; (4) mNeonGreen-linker-mScarlet-I; and (5) untransfected (wild-type). Fluorescence images show DAPI staining, mNeonGreen (mNG), mScarlet-I (mSI), and all three (merge). The exposure of the images was adjusted individually. For channels of cell lines not expressing certain fluorescent proteins, the scale was adjusted at maximum channel exposure, represented in the panel. (B) Expression of exogenous proteins in the five cell lines analyzed by western blots using primary antibodies against H2B (1), mScarlet-I (2), mNeonGreen (3) and nucleolin (loading control) (4). Labeling as in (A). Brightness and contrast were adjusted for individual panels.
Fig. 5.
Fig. 5.
Cell synchronization in G1, G1-PCC and mitosis for the FLIM experiment. (A) The scheme of cell synchronization before G1-PCC induction. (B) Methanol/acetic acid fixation and immunofluorescence with anti-centromere antibodies (ACA) of G1(upper), G G11-PCC (middle) and nocodazole-treated cells (lower). Enlarged insets of G1-PCC and metaphase chromosomes are shown on the right. Images of G1-PCC spreads and G1 cells were taken in one experiment (3 replicates), metaphase spreads of cells arrested in nocodazole were imaged in a separate experiment (2 replicates). Brightness and contrast of the centromeres on condensed chromosomes were adjusted to comparable levels. Maximum intensity projections of DAPI and ACA channels are shown. Scale bars represent 10 µM. (C) Quantification of phenotypes based on the presence of nuclei versus chromosomes and on the number of ACA dots on the chromosomes. A minimum of 200 cells or spreads were counted in each condition. G1-PCC spreads and G1cells were counted in one experiment (3 replicates), metaphase spreads of cells arrested in nocodazole were counted in a separate experiment (2 replicates).
Fig. 6.
Fig. 6.
G1-PCC and mitotic chromosomes display no differences in chromatin compaction as detected by FLIM-FRET. (A1) Distributions of lifetimes in the FLIM-FRET experiment. From left to right, cells expressing: mNeonGreen-linker-mScarlet-I (positive control); H2B-mNeonGreen and mScarlet-I-H2B (donor + acceptor); H2B-mNeonGreen and free mScarlet-I (negative control); and H2B-mNeonGreen (donor only). For each cell line, results for G1, G1-PCC, and nocodazole-arrested cells are shown from left to right. (A2) Magnified view of (A1) for all cell lines except the positive control. In A1 and A2, separate conditions and replicates were imaged on differing days. For statistical comparison, linear mixed effect models were fit for log(Lifetime). Cell line and condition were fit as fixed effects and slide (single replicate of a particular condition, i.e. the day of experiment) as a random effect. In the zoomed in plot (A2), the p-value adjustment was performed with the Benjamini Hochberg procedure. (B) Ratios of FRET efficiencies. FRET efficiencies were calculated as (1 – τDA/τD) using average lifetimes τDA for mNeonGreen-linker-mScarlet-I (positive control), H2B-mNeonGreen and mScarlet-I-H2B (donor + acceptor), and H2B-mNeonGreen and free mScarlet-I (negative control), and the average lifetime τD for H2B-mNeonGreen (donor only). FRET ratios were then calculated for (B1) H2B-mNeonGreen and mScarlet-I-H2B (donor + acceptor), and (B2) H2B-mNeonGreen and free mScarlet-I (negative control). This was done by dividing the FRET efficiencies of those cells by the FRET efficiency of the positive control, always using values from replicates processed on the same occasion under the same conditions. In each case, the data was analyzed with one-way ANOVA followed by the post-hoc Tukey test. The normality of distributions of residuals and homogeneity of variances were confirmed.

Similar articles

References

    1. Abad MA, Ruppert JG, Buzuk L, Wear M, Zou J, Webb KM, Kelly DA, Voigt P, Rappsilber J, Earnshaw WC, Jeyaprakash AA (2019) Borealin–nucleosome interaction secures chromosome association of the chromosomal passenger complex. J Cell Biol 218:3912–3925. doi: 10.1083/jcb.201905040 - DOI - PMC - PubMed
    1. Abe S, Nagasaka K, Hirayama Y, Kozuka-Hata H, Oyama M, Aoyagi Y, Obuse C, Hirota T (2011) The initial phase of chromosome condensation requires Cdk1-mediated phosphorylation of the CAP-D3 subunit of condensin II. Genes Dev 25:863–74. doi: 10.1101/gad.2016411. - DOI - PMC - PubMed
    1. Ajiro K, Yoda K, Utsumi K, Nishikawa Y (1996) Alteration of cell cycle-dependent histone phosphorylations by okadaic acid. Induction of mitosis-specific H3 phosphorylation and chromatin condensation in mammalian interphase cells. J Biol Chem 271:13197–201. doi: 10.1074/jbc.271.22.13197. - DOI - PubMed
    1. Akera T, Watanabe Y (2016) The spindle assembly checkpoint promotes chromosome bi-orientation: A novel Mad1 role in chromosome alignment. Cell Cycle 15(4):493–497. doi: 10.1080/15384101.2015.1128596 - DOI - PMC - PubMed
    1. Alipour E, Marko JF (2012) Self-organization of domain structures by DNA-loop-extruding enzymes. Nucleic Acids Res 40:11202–12. doi: 10.1093/nar/gks925. - DOI - PMC - PubMed

Publication types

LinkOut - more resources