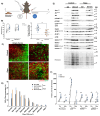
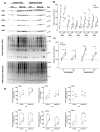
[Preprint]. 2025 Jul 27:2025.07.23.666188.
doi: 10.1101/2025.07.23.666188.

Response of UBR-box E3 ubiquitin ligases and protein quality control pathways to perturbations in protein synthesis and skeletal muscle size

Affiliations

Response of UBR-box E3 ubiquitin ligases and protein quality control pathways to perturbations in protein synthesis and skeletal muscle size

Leslie M Baehr et al. bioRxiv. .

Abstract

The N-degron pathway contributes to proteolysis by targeting N-terminal residues of destabilized proteins via E3 ligases that contain a UBR-box domain. Emerging evidence suggests the UBR-box family of E3 ubiquitin ligases (UBR1-7) are involved in the positive regulation of skeletal muscle mass. The purpose of this study was to explore the role of UBR-box E3 ubiquitin ligases under enhanced protein synthesis and skeletal muscle growth conditions. Cohorts of adult male mice were electroporated with constitutively active Akt (Akt-CA) or UBR5 RNAi constructs with a rapamycin diet intervention for 7 and 30 days, respectively. In addition, the UBR-box family was studied during the regrowth phase post nerve crush induced inactivity. Skeletal muscle growth with Akt-CA or regrowth following inactivity increased protein abundance of UBR1, UBR2, UBR4, UBR5 and UBR7. This occurred with corresponding increases in Akt-mTORC1/S6K and MAPK/p90RSK signaling and protein synthesis. The increases in UBR-box E3s, ubiquitination, and proteasomal activity occurred independently of mTORC1 activity and were associated with increases in markers related to autophagy, ER-stress, and protein quality control pathways. Finally, while UBR5 knockdown (KD) evokes atrophy, it occurs together with hyperactivation of mTORC1 and protein synthesis. In UBR5 KD muscles, we identified an increase in protein abundance for UBR2, UBR4 and UBR7, which may highlight a compensatory response to maintain proteome integrity. Future studies will seek to understand the role of UBR-box E3s towards protein quality control in skeletal muscle plasticity.

Keywords: N-degron pathway; UBR5; hypertrophy; proteasome system.


Conflict of interest statement

Conflict of Interest SCB is on the scientific advisory board for Emmyon Inc. All other authors declare that they do not have a conflict of interest.

Figures
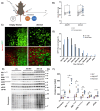
Figure 1.
Figure 1.. Differing degrees of Akt activity result in skeletal muscle growth and activation of mTORC1 signaling and translation.
Schematic diagram (A) of experimental design using in vivo electroporation delivery of wild type (Akt-WT) and constitutively active (Akt-CA) Akt constructs into male mouse TA muscle. Muscle mass (B) measurements (milligrams) for muscles transfected with either the empty vector (EV) or Akt-WT, and Akt-CA plasmids after 7 days (n=5-10/group). Representative microscope images (C) for green fluorescent protein (GFP) and laminin (red) in TA muscles transfected with EV or Akt-CA constructs (x10 magnification; scale bar = 100μm), highlighting transfection efficiency and muscle morphology after 7 days. Muscle cross-sectional area (CSA) distribution for EV and Akt-CA transfected muscles (D). GFP-positive fibers were measured for CSA, with ≥ 450 transfected fibers analyzed per animal, per muscle (n=5/group). Total number of fibers analyzed per group are reported in parentheses. For CSA data, fibers presented as percentage of fibers between 0 and 4800 μm plus size. Representative immunoblot images (E) for Akt/mTORC1 signaling and puromycin. Quantification of Akt/mTORC1 signaling and puromycin-labelling (F) in EV, Akt-WT, and Akt-CA transfected muscles (n=5/group). Total protein loading was used as the normalization control for all blots. Data presented as means ± SEM. *P<0.05; **P<0.01.
Figure 2.
Figure 2.. Response of UBR-box E3 ligases to increased Akt activity in transfected TA muscles and upon skeletal muscle regrowth following a period of neural inactivity.
Representative immunoblot images (A) for UBR-box E3 ubiquitin ligases and total ubiquitin. Quantification of UBR-box E3 ubiquitin ligases (UBR1, UBR2, UBR4, UBR5, and UBR7) and total ubiquitin (B) in empty vector (EV), Akt-WT, and Akt-CA transfected muscles (n=4-5/group). *P<0.05; **P<0.01 vs EV. Total protein loading was used as the normalization control for all blots. In EV, Akt-WT, and Akt-CA transfected muscles, mRNA expression (C) was determined via quantitative PCR for UBR1, UBR2, UBR4, UBR5, UBR7, MuRF1 (Trim63), and MAFbx (FBXO32). N=4–5/group. *P<0.05; **P<0.01 vs EV. Representative immunoblot images (D) for UBR-box E3 ubiquitin ligases across 21 to 60 days post nerve crush injury in gastrocnemius complex (GSTC) skeletal muscle. We have previously published the UBR5 protein response in the GSTC muscle following nerve crush injury (NCI) and the 21 to 60-day time period corresponds to the recovery (regrowth) of skeletal muscle mass following a period of disuse. (E) Quantification of UBR-box E3 ubiquitin ligases (UBR1, UBR2, UBR4, UBR5, and UBR7) in GSTC muscle from control and time points (21, 28 ,45, and 60 days post NCI) corresponding to skeletal muscle regrowth (n=4-5/group). Data presented as means ± SEM. *P<0.05 vs control.
Figure 3.
Figure 3.. Effect of rapamycin on Akt-induced skeletal muscle growth, mTORC1 dependent and independent signaling.
Schematic diagram (A) of experimental design using in vivo electroporation delivery of wild type (Akt-WT) and constitutively active (Akt-CA) Akt constructs into male mouse TA muscle. Male mice were provided either a control or rapamycin diet seven days prior to the electroporation procedure and kept on the respective diet for the remainder of the experiment. Muscle mass (B) measurements (milligrams) for muscles transfected with either the empty vector (EV) and Akt-CA plasmids for the control and rapamycin interventions after 7 days (n=10/group; left panel). The percentage difference in muscle mass compared to the EV transfected muscle for the control and rapamycin diets (right panel). Representative microscope images (C) for green fluorescent protein (GFP) and Laminin (red) in TA muscles transfected with EV or Akt-CA plasmid on the control or rapamycin diet (x10 magnification; scale bar = 100μm), highlighting transfection efficiency and muscle morphology after 7 days. Muscle cross-sectional area (CSA) distribution for EV and Akt-CA transfected muscles (D). GFP-positive fibers were measured for CSA, with ≥ 450 transfected fibers analyzed per animal, per muscle (n=5/group). Total number of fibers analyzed per group are reported in parentheses. For CSA data, fibers presented as percentage of fibers between 0 and 4800 μm plus size. Representative immunoblot images (E) for Akt/mTORC1 signaling and puromycin from EV and Akt-CA plasmids with control or rapamycin diet (n=5/group). Quantification of puromycin and phosphorylation status of rpS6, NDRG1 and p90RSK in control and rapamycin conditions with Akt overexpression (F). Data presented as means ± SEM. *P<0.05; **P<0.01.
Figure 4.
Figure 4.. Increase in UBR-box E3 ligase abundance and proteasome activity in Akt transfected skeletal muscles under suppressed mTORC1 activity.
Representative immunoblot images (A) for UBR-box E3 ubiquitin ligases, total ubiquitin, and K48-specific ubiquitin linkage. Quantification of UBR-box E3 ubiquitin ligases (UBR1, UBR2, UBR4, UBR5, and UBR7) (B), total ubiquitin, and K48 specific ubiquitin (C) in empty vector (EV) and Akt-CA transfected muscles under control or rapamycin diet conditions (n=5/group). Total protein loading was used as the normalization control for all blots. Proteasome activity assays were performed for 20S and 26S subunits (β1, β2, and β5) in transfected muscles (n=4/group; D). Data presented as means ± SEM. *P<0.05; **P<0.01.
Figure 5.
Figure 5.. Changes in autophagy-related and ER stress-related proteins with Akt transfected skeletal muscle independent of mTORC1 activity.
Representative immunoblot images (A) for autophagy-related markers, VCP, p62, and LC3B. Quantification of autophagy-related markers (B) in empty vector (EV) and Akt-CA transfected muscles under control or rapamycin diet conditions (n=5/group). Representative immunoblot images (C) for ER stress-related markers, BiP, PDI, CHOP, and eIF2α. Quantification of ER stress-related markers (D) in EV and Akt-CA transfected muscles under control or rapamycin diet conditions (n=5/group). Total protein loading was used as the normalization control for all blots. Representative microscope images for hematoxylin-eosin (H&E) in TA mouse muscles transfected with EV and Akt-CA plasmids under control and rapamycin diet conditions (×20 magnification; scale bar = 50 μm) highlighting muscle morphology after 7 days post electroporation (E). Examples of aberrant skeletal muscle fibers are identified on H&E images with yellow arrows and were quantified in EV and Akt-CA transfected muscles under control and rapamycin conditions (n=5/group) (F). Data presented as means ± SEM. *P<0.05; **P<0.01.
Figure 6.
Figure 6.. Loss of skeletal muscle mass and fiber size with UBR5 knockdown occurs independent of mTORC1 activity.
Schematic diagram (A) of experimental design using in vivo electroporation delivery of empty vector (EV) or UBR5 RNAi constructs into male mouse tibialis anterior (TA) muscle. Male mice were provided either a control or rapamycin (Rapa) diet for 30 days post electroporation. TA muscle mass (Bi) measurements (milligrams) for muscles transfected with either the EV or UBR5 RNAi plasmids for the control and rapamycin interventions after 30 days (n=9-10/group). Mean GFP-positive fiber size (Bii) was quantified for TA muscles transfected with EV or UBR5 RNAi under control or rapamycin diets (n=3-4/group). Representative microscope images (C) for green fluorescent protein (GFP) and Laminin (red) in TA muscles transfected with EV or UBR5 RNAi plasmid on the control or rapamycin diet (x10 magnification; scale bar = 100μm), highlighting transfection efficiency and muscle morphology after 30 days. Muscle fiber CSA distribution for EV and UBR5 RNAi transfected muscles (D). GFP-positive fibers were measured for CSA, with > 450 transfected fibers analyzed per animal, per muscle (n=4/group). Total number of fibers analyzed per group are reported in parentheses and represent Fiber CSA data for TA transfected muscles. For CSA data, fibers presented as percentage of fibers between 0 and 4800 μm. Representative immunoblot images (E) for Akt/mTORC1 signaling and puromycin from EV and UBR5 RNAi plasmids with control or rapamycin diet (n=5-6/group). Quantification of puromycin and phosphorylation status of Akt, p70S6K1, rpS6, and p90RSK in control and rapamycin conditions with UBR5 knockdown (F). Representative immunoblot images (G) for UBR-box E3 ubiquitin ligases. Quantification of UBR-box E3 ubiquitin ligases (UBR1, UBR2, UBR4, UBR5, and UBR7) (H) in EV and UBR5 RNAi transfected muscles (n=5-6/group) under control and rapamycin diet conditions. *P<0.05 vs. EV. Total protein loading was used as the normalization control for all blots. Data presented as means ± SEM. *P<0.05; **P<0.01.

Similar articles

  • An alternative pocket for binding the N-degrons by the UBR1 and UBR2 ubiquitin E3 ligases.
    Huang ST, Chen DH, Ren T, Thomas N, Wu J, Sankaran B, Jones R, Taylor S, Chen Y. Huang ST, et al. Protein Sci. 2025 Aug;34(8):e70248. doi: 10.1002/pro.70248. Protein Sci. 2025. PMID: 40880185 Free PMC article.
  • A family of mammalian E3 ubiquitin ligases that contain the UBR box motif and recognize N-degrons.
    Tasaki T, Mulder LC, Iwamatsu A, Lee MJ, Davydov IV, Varshavsky A, Muesing M, Kwon YT. Tasaki T, et al. Mol Cell Biol. 2005 Aug;25(16):7120-36. doi: 10.1128/MCB.25.16.7120-7136.2005. Mol Cell Biol. 2005. PMID: 16055722 Free PMC article.
  • Heterozygous UBR5 variants result in a neurodevelopmental syndrome with developmental delay, autism, and intellectual disability.
    Sabeh P, Dumas SA, Maios C, Daghar H, Korzeniowski M, Rousseau J, Lines M, Guerin A, Millichap JJ, Landsverk M, Grebe T, Lindstrom K, Strober J, Ait Mouhoub T, Zweier C, Steinraths M, Hebebrand M, Callewaert B, Abou Jamra R, Kautza-Lucht M, Wegler M, Kruszka P, Kumps C, Banne E, Waberski MB, Dieux A, Raible S, Krantz I, Medne L, Pechter K, Villard L, Guerrini R, Bianchini C, Barba C, Mei D, Blanc X, Kallay C, Ranza E, Yang XR, O'Heir E, Donald KA, Murugasen S, Bruwer Z, Calikoglu M, Mathews JM, Lesieur-Sebellin M, Baujat G, Derive N, Pierson TM, Murrell JR, Shillington A, Ormieres C, Rondeau S, Reis A, Fernandez-Jaen A, Au PYB, Sweetser DA, Briere LC, Couque N, Perrin L, Schymick J, Gueguen P, Lefebvre M, Van Andel M, Juusola J, Antonarakis SE, Parker JA, Burnett BG, Campeau PM. Sabeh P, et al. Am J Hum Genet. 2025 Jan 2;112(1):75-86. doi: 10.1016/j.ajhg.2024.11.009. Epub 2024 Dec 24. Am J Hum Genet. 2025. PMID: 39721588 Free PMC article.
  • Signaling Pathways Regulated by UBR Box-Containing E3 Ligases.
    Kim JG, Shin HC, Seo T, Nawale L, Han G, Kim BY, Kim SJ, Cha-Molstad H. Kim JG, et al. Int J Mol Sci. 2021 Aug 3;22(15):8323. doi: 10.3390/ijms22158323. Int J Mol Sci. 2021. PMID: 34361089 Free PMC article. Review.
  • The Black Book of Psychotropic Dosing and Monitoring.
    DeBattista C, Schatzberg AF. DeBattista C, et al. Psychopharmacol Bull. 2024 Jul 8;54(3):8-59. Psychopharmacol Bull. 2024. PMID: 38993656 Free PMC article. Review.

References

    1. Hughes DC, Ellefsen S, and Baar K. Adaptations to endurance and strength training. Cold Spring Harbor perspectives in medicine a029769, 2017. - PMC - PubMed
    1. Baehr LM, Hughes DC, Waddell DS, and Bodine SC. Snapshot: Skeletal muscle atrophy. Cell 185: 1618–1618. e1611, 2022. - PubMed
    1. Sharples AP, Hughes DC, Deane CS, Saini A, Selman C, and Stewart CE. Longevity and skeletal muscle mass: the role of IGF signalling, the sirtuins, dietary restriction and protein intake. Aging cell 14: 511–523, 2015. - PMC - PubMed
    1. Bodine SC, Stitt TN, Gonzalez M, Kline WO, Stover GL, Bauerlein R, Zlotchenko E, Scrimgeour A, Lawrence JC, and Glass DJ. Akt/mTOR pathway is a crucial regulator of skeletal muscle hypertrophy and can prevent muscle atrophy in vivo. Nature cell biology 3: 1014–1019, 2001. - PubMed
    1. Baar K, and Esser K. Phosphorylation of p70S6kcorrelates with increased skeletal muscle mass following resistance exercise. American Journal of Physiology-Cell Physiology 276: C120–C127, 1999. - PubMed

Publication types

LinkOut - more resources