[Preprint]. 2025 Jul 26:2025.07.22.666210.
doi: 10.1101/2025.07.22.666210.

Mono-mix strategy enables comparative proteomics of a cross-kingdom microbial symbiosis

Affiliations

Mono-mix strategy enables comparative proteomics of a cross-kingdom microbial symbiosis

Sunnyjoy Dupuis et al. bioRxiv. .

Abstract

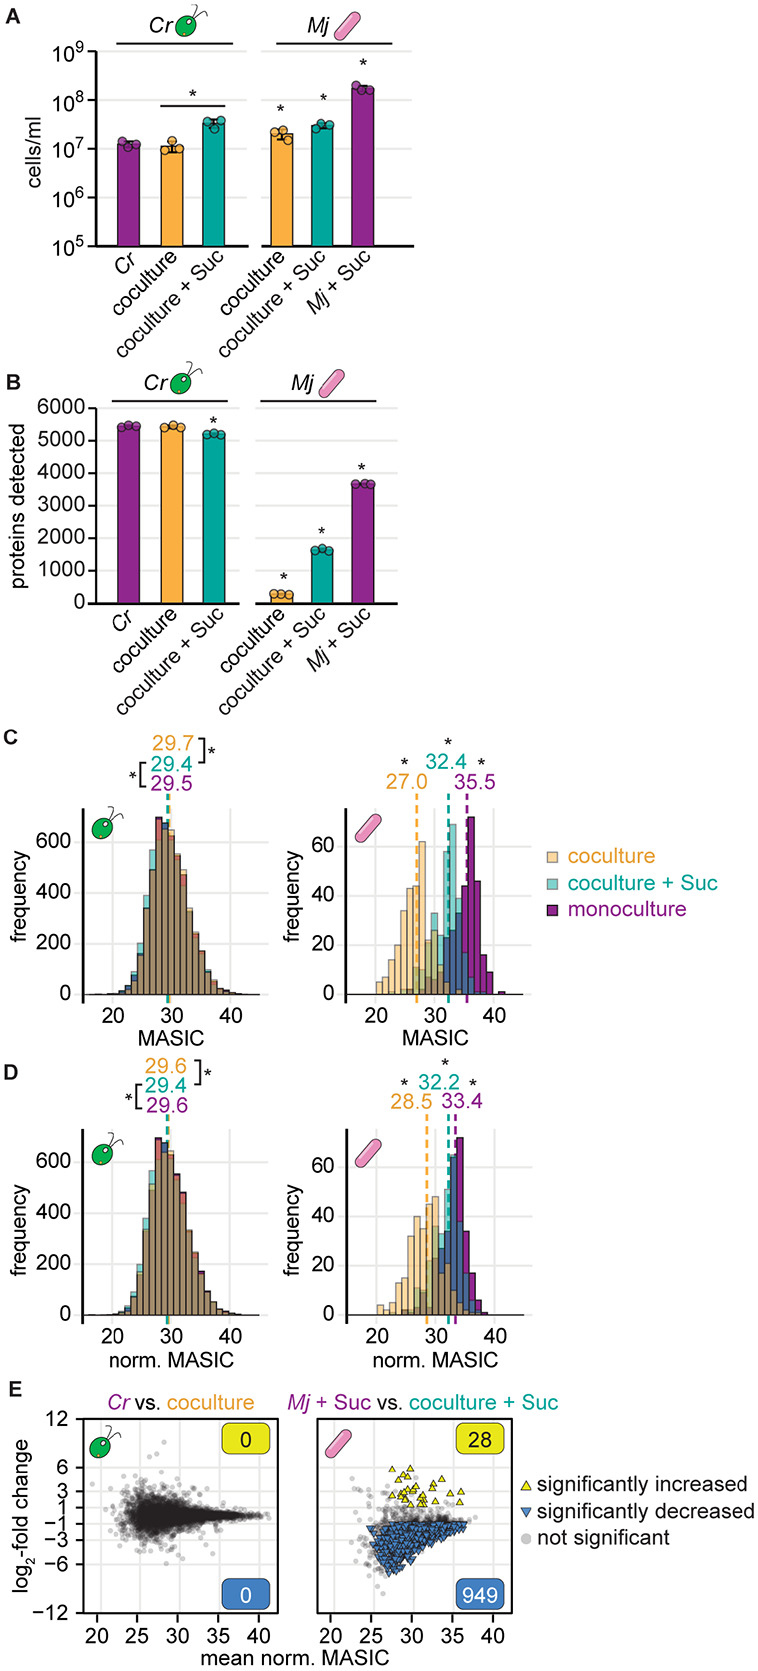
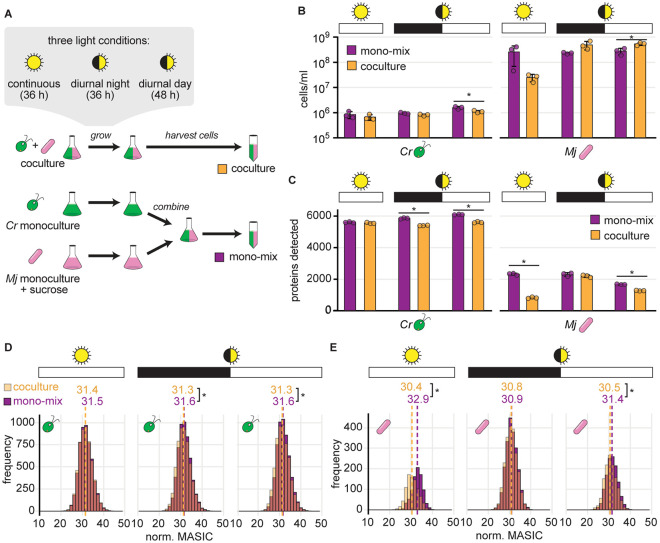
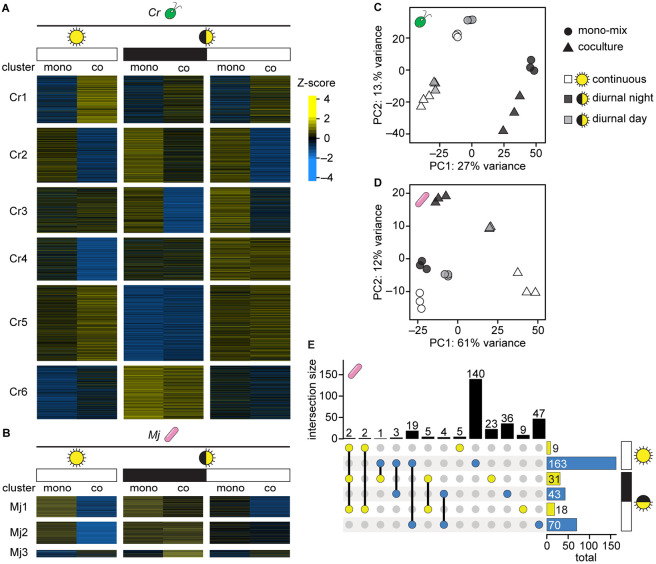
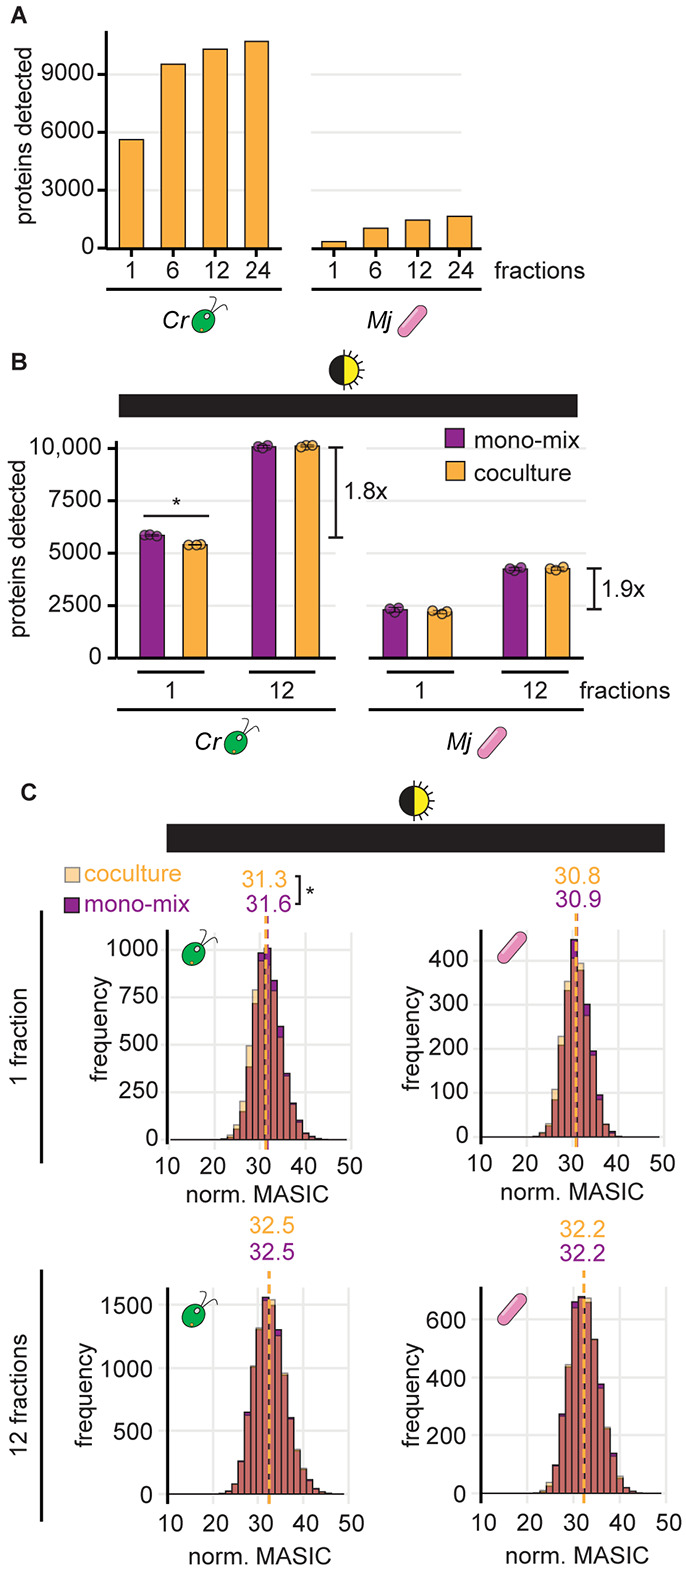
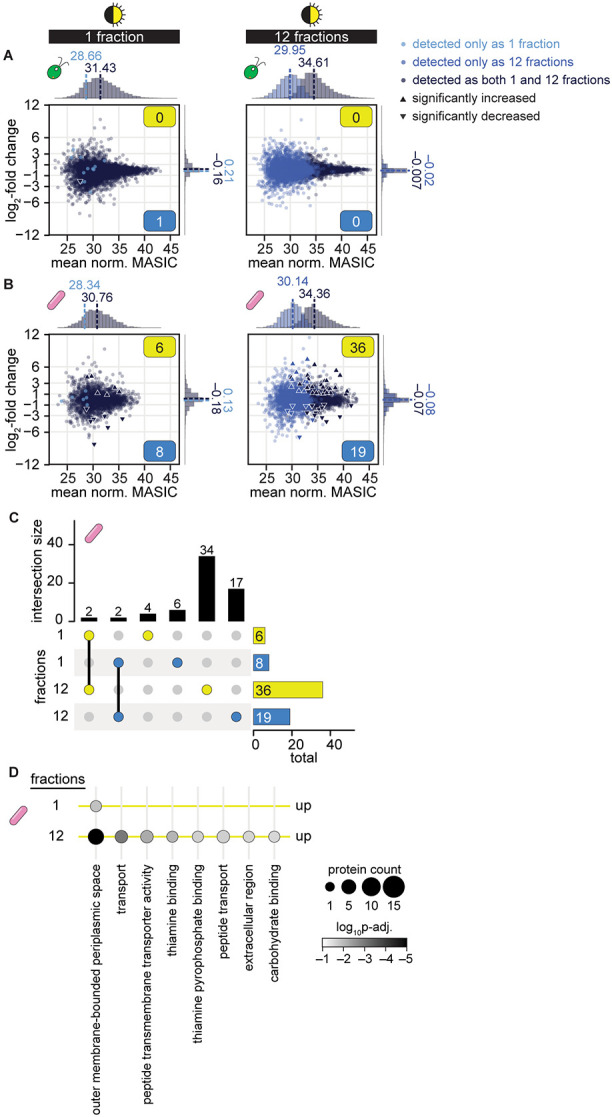
Cross-kingdom microbial symbioses, such as those between algae and bacteria, are key players in biogeochemical cycles. The molecular changes during initiation and establishment of symbiosis are of great interest, but quantitatively monitoring such changes can be challenging, particularly when the microorganisms differ greatly in size or are intimately associated. Here, we analyze output from data-dependent acquisition (DDA) LC-MS/MS proteomics experiments investigating the well-studied interaction between the alga Chlamydomonas reinhardtii and the heterotrophic bacterium Mesorhizobium japonicum. We found that detection of bacterial proteins decreased in coculture by 50% proteome-wide due to the abundance of algal proteins. As a result, standard differential expression analysis led to numerous false-positive reports of significantly downregulated proteins, where it was not possible to distinguish meaningful biological responses to symbiosis from artifacts of the reduced protein detection in coculture relative to monoculture. We show that data normalization alone does not eliminate the impact of altered detection on differential expression analysis of the cross-kingdom symbiosis. We assessed two additional strategies to overcome this methodological artifact inherent to DDA proteomics. In the first, we combined algal and bacterial monocultures at a relative abundance that mimicked the coculture, creating a "mono-mix" control to which the coculture could be compared. This approach enabled comparable detection of bacterial proteins in the coculture and the monoculture control. In the second strategy, we enhanced detection of lowly abundant bacterial proteins by using sample fractionation upstream of LC-MS/MS analysis. When these simple approaches were combined, they allowed for meaningful comparisons of nearly 10,000 algal proteins and over 4,000 bacterial proteins in response to symbiosis by DDA. They successfully recovered expected changes in the bacterial proteome in response to algal coculture, including upregulation of sugar-binding proteins and transporters. They also revealed novel proteomic responses to coculture that guide hypotheses about algal-bacterial interactions.

Keywords: Dual-proteomics; chlorophyte; label-free quantitation; mixed cultures; rhizobia; shotgun proteomics.


Figures

Fig 1.
Fig 1.. Detection of bacterial proteins decreases in coculture samples.
Triplicate continuous-light-grown monocultures and cocultures with and without sucrose were collected for LC-MS/MS proteomics. See also S1 and S2 Figs. (A) Density of C. reinhardtii cells (left) and M. japonicum CFU (right) in triplicate monocultures (purple), cocultures (orange), and cocultures with sucrose (turquoise) upon collection for proteomics. The bars represent the mean of three replicate cultures, and error bars represent the standard deviation from the mean. Asterisks indicate significant differences by two-tailed Student’s t-tests (p < 0.05). (B) Number of unique C. reinhardtii proteins (left) and M. japonicum proteins (right) detected in samples from (A) by LC-MS/MS proteomics. Asterisks indicate significant differences as in (A). (C) Distribution of algal (left) and bacterial protein abundances (right) in cocultures (transparent orange), cocultures with sucrose (transparent turquoise), and monocultures (purple) for proteins detected in all three conditions. When distributions overlap, the color is muddied. The unnormalized MASIC values were averaged across the three biological replicates. Median values are shown above the dashed lines. Asterisks next to the medians indicate significant differences between the indicated distributions by a Wilcoxon rank-sum test (p < 0.05). (D) Distribution of algal (left) and bacterial protein abundances (right) in cocultures (transparent orange), cocultures with sucrose (transparent turquoise), and monocultures (purple) after quantile normalization, presented as in (C). (E) Changes in quantile-normalized protein abundances in coculture relative to monoculture for C. reinhardtii (left) and M. japonicum (right). Significant differences (triangles) were defined as those where ∣log2-fold change∣ > 1, p-adj. < 0.05 from a Student’s t-test of the quantile-normalized MASIC values, and the mean MASIC value was greater than the limit of quantitation in both the coculture and the monoculture.
Fig 2.
Fig 2.. The mono-mix strategy enables comparable DDA detection of bacterial proteins in the coculture and the monoculture control when a similar bacteria-to-algae ratio is achieved.
See also S3 and S4 Figs. (A) Schematic of experiment. Triplicate cocultures of C. reinhardtii (green) and M. japonicum (pink) were grown in parallel with triplicate monocultures of C. reinhardtii and M. japonicum with 150 μg/ml sucrose. Then, the M. japonicum monocultures were added to the C. reinhardtii monocultures to achieve a “mono-mix” control (purple) with a similar bacteria-to-algae ratio as the coculture (orange). Cultures were grown in either continuous (sun icon) or diurnal light (eclipsed sun icon). Continuous light cultures were collected 36 h after inoculation, and the diurnal light cultures were collected at the end of the night (36 h after inoculation) and the end of the day (48 h after inoculation). (B) Density of C. reinhardtii cells and M. japonicum CFU in triplicate cocultures (orange) and mono-mix controls (purple) grown in continuous light (sun icon) or diurnal light (eclipsed sun icon) upon collection for proteomics at the end of the dark or light phases (black or white bars, respectively). The bars represent the mean of three replicate cultures, and error bars represent the standard deviation from the mean. Asterisks indicate significant differences by two-tailed Student’s t-tests (p < 0.05). (C) Number of unique algal (left) and bacterial proteins (right) detected in the samples from (B). Asterisks indicate significant differences as in (B). (D) Distribution of normalized abundances of algal proteins in cocultures (transparent orange) and mono-mix controls (purple) grown in continuous light (sun icon) or diurnal light (eclipsed sun icon) collected at the end of the dark or light phases (black or white bars, respectively). When distributions overlap, the color is muddied. The quantile-normalized MASIC values were averaged across the three biological replicates. Median values are shown above the dashed lines. Asterisks next to the medians indicate significant differences between the indicated distributions by a Wilcoxon rank-sum test (p < 0.05). (E) Distribution of normalized abundances of bacterial proteins presented as in (D).
Fig 3.
Fig 3.. Data normalization and comparison to mono-mix controls reveals that light regime may influence the M. japonicum proteome during coculture with C. reinhardtii.
(A) k-means clustering (k = 6) of the Z-score of quantile-normalized mean algal protein abundances in the mono-mix experiment. 4737 C. reinhardtii proteins that were detected in at least two biological replicates in all conditions were included in the analysis. (B) k-means clustering (k = 3) of the Z-score of quantile-normalized mean bacterial protein abundances in the mono-mix experiment. 828 M. japonicum proteins that were detected in at least two biological replicates in all conditions were included in the analysis. (C) PCA of quantile-normalized protein abundances for the 3817 C. reinhardtii proteins that were detected in all samples: three biological replicates of the mono-mix (circles) and coculture samples (triangles) under continuous light (white), diurnal night (dark grey), and diurnal day (light grey). (D) PCA of quantile-normalized protein abundances for the 569 M. japonicum proteins that were detected in all samples, presented as in (C). (E) Intersections and differences in the bacterial proteins that were significantly increased (yellow) and significantly decreased (blue) in samples collected from continuous light, diurnal night, and diurnal day. Intersection sizes (indicated by lines connecting colored dots) and differences (indicated by single colored dots) are shown as the vertical bars, while the total number of bacterial proteins that are significantly increased and decreased are shown as the horizontal bars. Significant differences were defined as those where ∣log2-fold change∣ > 1, p-adj. < 0.05 from a Student’s t-test of the quantile-normalized MASIC values, and the mean MASIC value was greater than the limit of quantitation in both the coculture and the monoculture. See also S5 Fig.
Fig 4.
Fig 4.. Fractionation improves detection of sparse bacterial proteins in coculture.
(A) The number of unique algal (left) and bacterial proteins (right) detected when a coculture sample was analyzed as 1, 6, 12, or 24 fractions. (B) The number of unique algal (left) and bacterial proteins (right) detected from cocultures (orange) and mono-mix controls (purple) collected at the end of the night from diurnal light-grown cultures when analyzed as 1 or 12 fractions. Bars represent the mean of three replicate cultures, and error bars represent the standard deviation from the mean. Asterisks indicate significant differences by two-tailed Student’s t-tests (p < 0.05). (C) Distribution of normalized abundances of algal (left) and bacterial proteins (right) in cocultures (transparent orange) and mono-mix controls (purple) collected at the end of the night when analyzed as 1 (top) or 12 fractions (bottom). When distributions overlap, the color is muddied. The quantile-normalized MASIC values were averaged across the three biological replicates. Median values are shown above the dashed lines. Asterisks next to the medians indicate significant differences between the indicated distributions by a Wilcoxon rank-sum test (p < 0.05).
Fig 5.
Fig 5.. Sample fractionation improves differential expression analysis of proteins in cocultures relative to mono-mix controls.
See also S6 Fig. (A) Changes in quantile-normalized C. reinhardtii protein abundance in coculture relative to mono-mix controls at the end of the night when samples were analyzed as 1 (left) or 12 fractions (right). Points are colored based on their detection criteria: lighter blue indicates that the protein only met the criteria when the sample was analyzed as either 1 or 12 fractions, navy blue indicates that the protein met the criteria when the sample was analyzed both as 1 and as 12 fractions. Significant differences (triangles) were defined as those where ∣log2-fold change∣ > 1, p-adj. < 0.05 from a Student’s t-test of the quantile-normalized MASIC values, and the mean MASIC value was greater than the limit of quantitation in both the coculture and the mono-mix. Yellow and blue boxes indicate the number of significantly increased and decreased proteins, respectively. Histograms show the distribution of mean protein abundances (x axes) and of log2-fold changes (y axes) for proteins that only met the detection criteria when the sample was analyzed as either 1 or 12 fractions (lighter blue) and for proteins that met the detection criteria when the sample was analyzed both as 1 and as 12 fractions (navy blue); median values are shown above the dashed lines. (B) Changes in quantile-normalized M. japonicum protein abundance in coculture relative to mono-mix controls at the end of the night when samples were analyzed as 1 (left) or 12 fractions (right) presented as in (A). (C) Intersections and differences in the bacterial proteins that were significantly increased (yellow) and significantly decreased (blue) in coculture when samples were analyzed as 1 or 12 fractions. Intersection sizes (indicated by lines connecting colored dots) and differences (indicated by single colored dots) are shown as the vertical bars, while the total number of bacterial proteins that are significantly increased and decreased are shown as the horizontal bars. (D) GO term enrichment in bacterial proteins that were significantly increased in quantile-normalized abundance in coculture when samples were analyzed as 1 or 12 fractions. The number of proteins with the corresponding GO term in each comparison is indicated by dot size and the p-adj. by the shading. No GO terms were significantly enriched in the bacterial proteins that were significantly decreased in quantile-normalized abundance in coculture, regardless of sample fractionation.

Similar articles

References

    1. Hungate Robert E.. The Rumen and its Microbes. Elsevier; 1966. doi: 10.1016/C2013-0-12555-X - DOI
    1. Mizrahi I, Wallace RJ, Moraïs S. The rumen microbiome: balancing food security and environmental impacts. Nat Rev Microbiol. 2021;19: 553–566. doi: 10.1038/s41579-021-00543-6 - DOI - PubMed
    1. Zhang L, Feng G, Declerck S. Signal beyond nutrient, fructose, exuded by an arbuscular mycorrhizal fungus triggers phytate mineralization by a phosphate solubilizing bacterium. The ISME Journal. 2018;12: 2339–2351. doi: 10.1038/s41396-018-0171-4 - DOI - PMC - PubMed
    1. Rozmoš M, Bukovská P, Hršelová H, Kotianová M, Dudáš M, Gančarčíková K, et al. Organic nitrogen utilisation by an arbuscular mycorrhizal fungus is mediated by specific soil bacteria and a protist. The ISME Journal. 2022;16: 676–685. doi: 10.1038/s41396-021-01112-8 - DOI - PMC - PubMed
    1. Duan S, Feng G, Limpens E, Bonfante P, Xie X, Zhang L. Cross-kingdom nutrient exchange in the plant–arbuscular mycorrhizal fungus–bacterium continuum. Nat Rev Microbiol. 2024;22: 773–790. doi: 10.1038/s41579-024-01073-7 - DOI - PubMed

Publication types