[Preprint]. 2025 Jul 21:2025.07.16.665173.
doi: 10.1101/2025.07.16.665173.

Fusiform Cells in the Dorsal Cochlear Nucleus Change Intrinsic Electrophysiological Properties and Morphologically Remodel Their Basal Dendrites with Age

Affiliations

Fusiform Cells in the Dorsal Cochlear Nucleus Change Intrinsic Electrophysiological Properties and Morphologically Remodel Their Basal Dendrites with Age

Reginald J Edwards et al. bioRxiv. .

Abstract

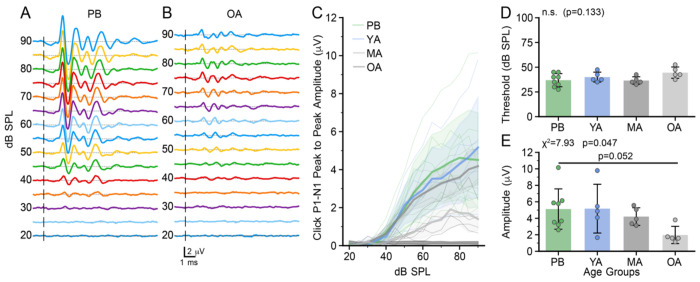
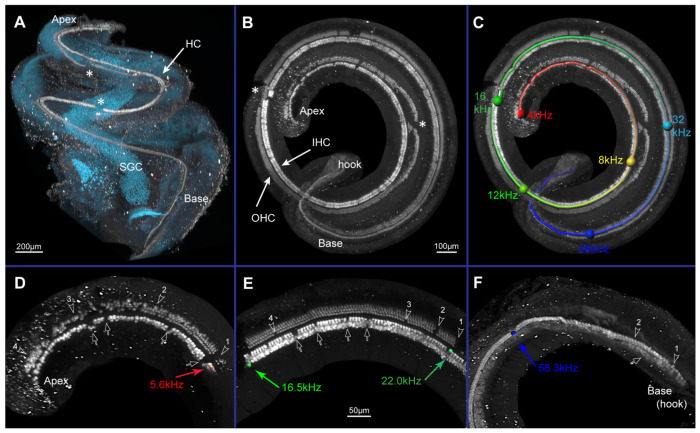
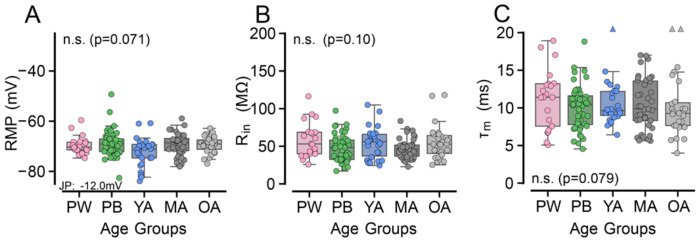
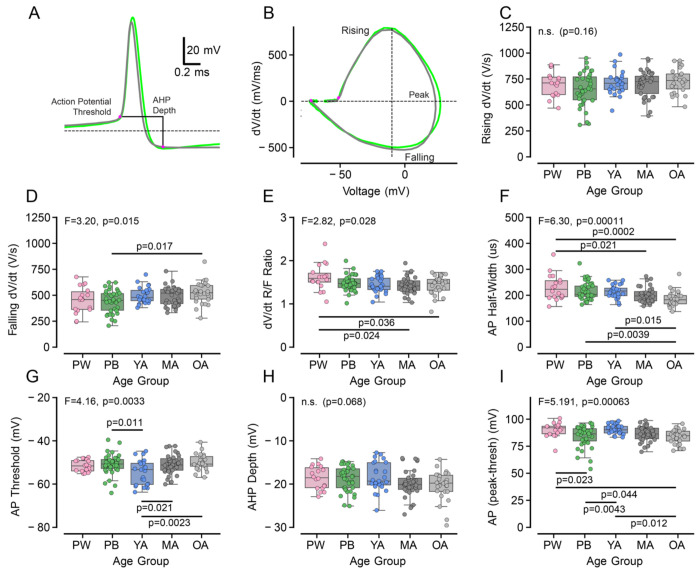
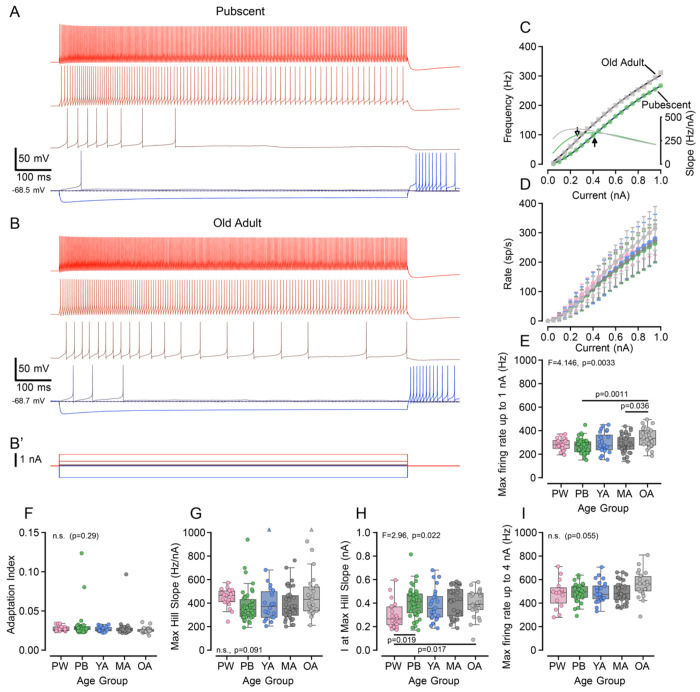
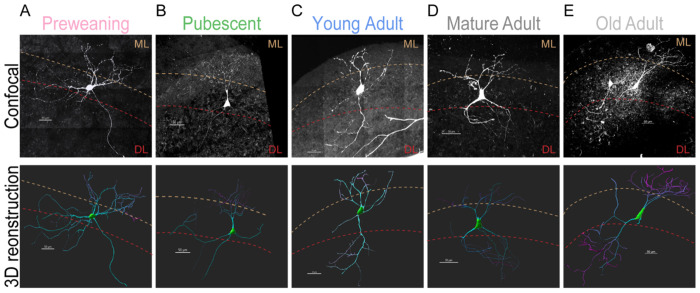
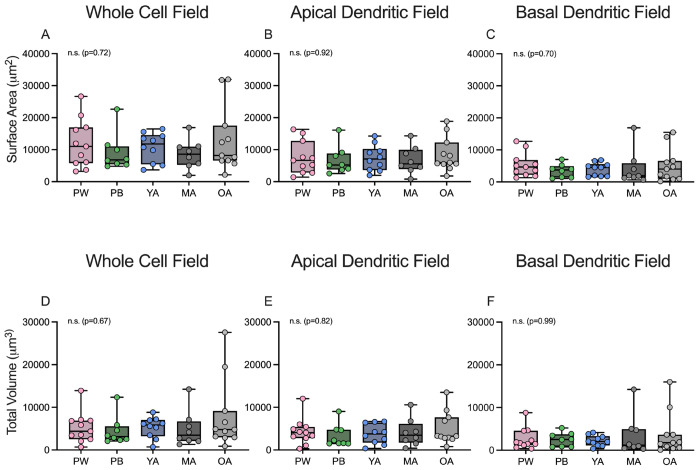
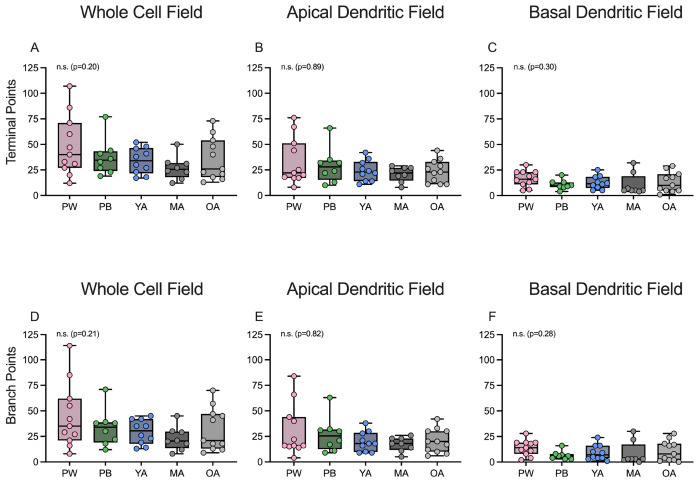
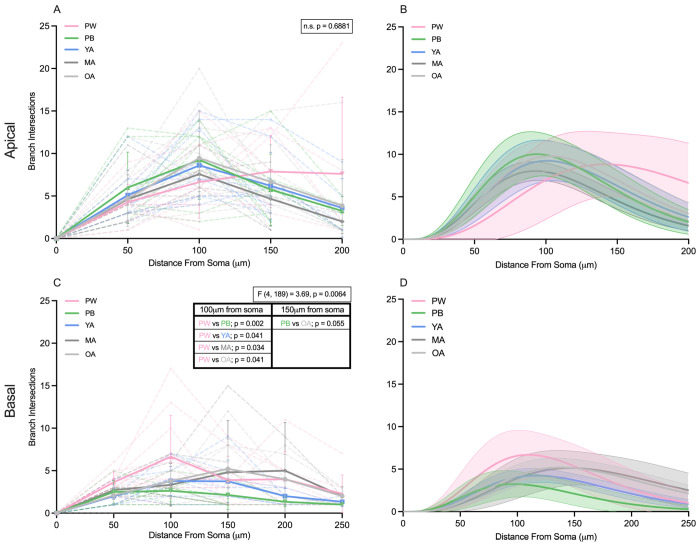
Age-related hearing loss (ARHL) is the most common cause of sensorineural hearing loss. The cochlear nucleus, the first central auditory structure to receive input from the cochlea, has been shown to be disrupted by ARHL. Fusiform cells (FC), the principal output cell of the dorsal part of the cochlear nucleus (DCN), mature physiologically during hearing onset. Specifically, FCs increase in rate of action potential (AP) rise and decay, stabilizing by postnatal day 14 (P14) in mice. However, whether FC intrinsic electrophysiological properties and morphological characteristics continue to change throughout the life of mice, and how they change due to ARHL, is unknown. We characterized electrophysiological and morphological properties of FCs from CBA/CaJ mice at five stages of age: preweaning (P15-20), pubescent (P21-49), young adult (P50-179), mature adult (P180-364), and old adult (P550-578). Our old adult mice had smaller auditory brainstem evoked response amplitudes and loss of some hair cells, indicative of ARHL onset. We observed no change in FC membrane properties with age. FCs from the old adult group had elevated firing rates, faster repolarization rates, and shorter AP half-widths. Morphologically, there was no change in FC soma shape or size. However, a significant decrease in basal dendritic arborization occurred between preweaning and pubescent ages, followed by an increase in our old adult group, suggesting age-dependent remodeling of the basal dendritic tree at the onset of ARHL. Together, these results suggest that FC physiology and morphology are relatively stable post weaning and become altered during the onset of ARHL.

Keywords: Cochlear Nucleus; Pyramidal Cell; hearing loss; intrinsic excitability; neuron morphology.


Figures

Figure 1.
Figure 1.
Click-evoked auditory brainstem evoked responses (ABR) as a function of age in a subset of the mice used in this study. A-B: ABRs as a function of level in a pubescent (A) and an old adult (B) mouse. C: Summary of individual ABR derived P1-N1 growth functions (thin lines) and means (thick lines). Shaded areas indicate the standard deviation of the data for each age group. D: Summary of ABR thresholds derived from the growth functions in C for each age group. E: Maximal amplitude of the P1-N1 amplitude for each age group. Bars indicate means, error bars indicate standard deviations. Categories: PB: pubescent, YA: young adult; MA: mature adult; OA: old adult.
Figure 2.
Figure 2.
Light sheet fluorescence microscope images from a 573-day old mouse cochlea immunolabeled for Myosin VIIa. A: Three-dimensional view of labeled hair cells (HC) along basilar membrane from base to apex, spiral ganglion cells (SGC) imaged by autofluorescence. B: Virtually dissected basilar membrane (viewed from apex) showing labeled outer (OHC) and inner hair cells (IHC). C: Panel B overlayed with distance-to-frequency map. Spheres indicate pure tone frequency areas. D-F: hair cell distribution across apical (D), middle (E), and basal (F) 10% lengths of basilar membrane. Across all regions, IHC’s (hollow arrows) may appear disarrayed or missing; OHC’s (hollow arrowheads) can be missing all rows or reduced from three rows to one or two rows. Asterisks = artifact from errant forceps pinch during temporal bone dissection. Scale bars: for C same as in B; for D-F is in E.
Figure 3.
Figure 3.
Passive membrane properties of fusiform cells across age. A: Resting membrane potential (RMP), corrected for the junction potential (JP) of −12 mV. Resting potential did not change with age. B: Cell input resistance (Rin) was independent of age. C: The membrane time constant (τm) did not change with age Age groups: PW: preweaning, PB: pubescent, YA: young adult, MA: mature adult, OA: old adult. Triangles at top of axes in C indicate measurements that are out of the range of the graph axes. Statistics indicate F and p for 1-way ANOVA; n.s. indicates not significant at the p=0.05 level.
Figure 4.
Figure 4.
Individual action potential (AP) properties change with age. A: Representative APs from the pubescent (PB) and old adult (OA) age groups. The location of the AP threshold (20 mV/ms) and measurement of the afterhyperpolarization depth are indicated by magenta dots and the black line. Dashed line: −60 mV. B: Phase plots derived from the APs displayed in A. Labels show the maximal rising rate, falling rate, and location of the peak AP voltage. Magenta dots show the AP threshold and nadir of the AHP. C-D: Quantification of the maximum rising (C) and falling (D) slopes of APs across age. E: The ratio between the maximum rising and falling AP rates across age. F-I: Quantification of AP half-widths (F), threshold potential (G), afterhyperpolarization (H), and peak AP voltage (I) across age. Age groups: PW: preweaning, PB: pubescent, YA: young adult, MA: mature adult, OA: old adult. Statistics indicate F and p for 1-way ANOVA; n.s. indicates not significant at the p=0.05 level. Significant posthoc comparisons (Tukey corrected) are indicated by horizontal bars and p-values.
Figure 5.
Figure 5.
Fusiform cells change their firing properties with age. A-B: Example traces of responses to current injection from a pubescent (A) and an old adult (B) FC. Responses to a single hyperpolarizing current injection are also shown. B’: Current steps for A and B. C: Firing rate versus current injection for 1-s pulses from the cells in A and B. Left axis: firing rate is plotted with symbols with the smooth lines denoting best fit of a Hill function to the curve. Right axis: the slope (gain) of the Hill plot as a function of current. Arrows indicate the location of the maximal firing gain, as summarized in G and H. D: Comparison of firing rate curves for all groups, showing mean and 95% confidence intervals for each current level. E-F: Quantification of the maximum firing rate at 1 nA (E) and the rate of firing adaptation (F) across age groups. G-I: The maximal firing rate gain (G), current level at which the firing rate gain was largest (H) and the maximal firing rate at 4 nA (I) of FCs across age. Triangles at the top of the plot in panel G indicate measurements that are out of range of the graph axes. Age groups: PW: preweaning, PB: pubescent, YA: young adult, MA: mature adult, OA: old adult. Statistics indicate F and p for 1-way ANOVA; n.s. indicates not significant at the p=0.05 level. Significant posthoc comparisons (Tukey corrected) are indicated by horizontal bars and p-value.
Figure 6.
Figure 6.
Representative fusiform cell confocal images and their corresponding 3D reconstructions. A-E: Confocal images (top row) are maximum intensity projections (MIPs) of lucifer-yellow injected FCs from brain slices, post electrophysiological recording. MIPs are then imported into IMARIS for 3D reconstruction (bottom row). Brown dashed line represents approximate bottom edge of the molecular layer (ML), while the red dashed line represents the approximate top edge of the deep layer (DL). Age groups: A: preweaning, B: pubescent, C: young adult, D: mature adult, E: old adult. All scale bars are 50 microns.
Figure 7:
Figure 7:
Fusiform cells do not change in size with age. A-C: Total surface area of the entire reconstructed neuron (A), the apical dendritic field (B), or the basal dendritic field (C). D-F: Total volume of the entire reconstructed neuron (D), the apical dendritic field (E), or the basal dendritic field (F). Either Kruskal-Wallis or Brown-Forsythe 1-way ANOVA was used for statistical analysis. n.s. = not significant (p values given in parentheses). Age groups: PW: preweaning, PB: pubescent, YA: young adult, MA: mature adult, OA: old adult.
Figure 8:
Figure 8:
Fusiform cells do not change overall branching or terminal point number with age. A-C: Total terminal point number of the entire reconstructed neuron (A), the apical dendritic field (B), or the basal dendritic field (C). D-F: Total branch point number of the entire reconstructed neuron (D), the apical portion (E), or the basal portion (F). Kruskal-Wallis 1-way ANOVA was used for statistical analysis, with alpha = 0.05. n.s. = not significant (p values given in parentheses). Age groups: PW: preweaning, PB: pubescent, YA: young adult, MA: mature adult, OA: old adult.
Figure 9:
Figure 9:
Fusiform cells prune and remodel their basal dendrites with age. A,C: Sholl analysis of the apical (A) and basal (C) dendritic tree. Dashed lines indicate individual neurons, while solid lines indicate means for each age group. Error bars are denoted as standard deviation. B,D: Gamma fit curves of each age group for the apical (B) and basal (D) dendritic tree. Solid lines denote gamma fit to the mean, while shaded regions denote 95% confidence interval bands. 2-way ANOVA (distance and age) used for statistical analysis, with alpha = 0.05. All statistical analysis was conducted on raw data set (A and C). If significance is found with the omnibus test, Tukey’s multiple comparisons post-hoc test is completed. Statistics located in black boxes denote omnibus calculations. n.s. = not significant. Age groups: PW: preweaning, PB: pubescent, YA: young adult, MA: mature adult, OA: old adult.

Similar articles

References

    1. Liberman MC, Kujawa SG. Cochlear synaptopathy in acquired sensorineural hearing loss: Manifestations and mechanisms. Hear Res 349: 138–147, 2017. doi: 10.1016/j.heares.2017.01.003. - DOI - PMC - PubMed
    1. Kurabi A, Keithley EM, Housley GD, Ryan AF, Wong AC- Y. Cellular mechanisms of noise-induced hearing loss. Hear Res 349: 129–137, 2017. doi: 10.1016/j.heares.2016.11.013. - DOI - PMC - PubMed
    1. Hoffman HJ, Dobie RA, Ko C-W, Themann CL, Murphy WJ. Hearing threshold levels at age 70 years (65-74 years) in the unscreened older adult population of the United States, 1959-1962 and 1999-2006. Ear Hear 33: 437–440, 2012. doi: 10.1097/AUD.0b013e3182362790. - DOI - PubMed
    1. Huang AR, Jiang K, Lin FR, Deal JA, Reed NS. Hearing Loss and Dementia Prevalence in Older Adults in the US. JAMA 329: 171–173, 2023. doi: 10.1001/jama.2022.20954. - DOI - PMC - PubMed
    1. Wu P, O’Malley JT, Gruttola V de, Liberman MC. Age-Related Hearing Loss Is Dominated by Damage to Inner Ear Sensory Cells, Not the Cellular Battery That Powers Them. J Neurosci 40: 6357–6366, 2020. doi: 10.1523/JNEUROSCI.0937-20.2020. - DOI - PMC - PubMed

Publication types