[Preprint]. 2025 Jul 22:2025.07.18.665534.
doi: 10.1101/2025.07.18.665534.

The CPEB ortholog Orb2 regulates brain size through the TRIM-NHL RNA-binding protein, Brain tumor

Affiliations

The CPEB ortholog Orb2 regulates brain size through the TRIM-NHL RNA-binding protein, Brain tumor

Taylor Hailstock et al. bioRxiv. .

Abstract

Neurodevelopment requires precise translational control, the disruption of which is implicated in various neurological disorders, including developmental delays, intellectual disability, and microcephaly. We report a novel role for the Drosophila CPEB-family protein Orb2, a translational regulator, in controlling brain size in a dose dependent manner. Loss of orb2 results in larval brain hypotrophy, whereas orb2 overexpression causes brain overgrowth. We demonstrate that orb2 is required for neural stem cell development from embryonic stages through larval neurogenesis. Structure-function analysis reveals that Orb2 RNA-binding activity promotes brain growth, while its poly-Q and ZZ domains act to restrain overgrowth. Further genetic and biochemical evidence indicates that orb2 functions upstream of the translational repressor Brain tumor (Brat), modulating Brat protein levels and, consequently, influencing brain size. These findings support a model wherein the antagonistic activities of Orb2 and Brat are critical for balanced brain growth during Drosophila neurodevelopment.

Keywords: brain growth; microcephaly; models of human disease; neurodevelopment; organ size.


Conflict of interest statement

Disclosures and competing interests The authors have no competing interests to declare.

Figures
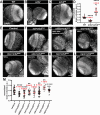
Figure 1.
Figure 1.. orb2 is necessary and sufficient for brain growth.
Images show the optic lobe region (dashed circles) from age-matched third instar larval brains of the indicated genotypes stained for DAPI. (A) WT, (B) orb2 null (orb2Δ36) mutants show reduced brain size, and (C) act-GAL4 driven expression of UAS-orb2 (orb2OE) results in increased brain volumes, as quantified in (D). Graph shows normalized brain volumes, where each dot represents a measurement of a single optic lobe from N=13 WT, 17 orb2, and 15 orb2OE brains. Data shown are pooled from 2 (WT, orb2OE ) or 3 (orb2) independent biological replicates. Representative images of brains expressing (E) UAS-orb2RNAi (no-GAL4 control) alone or (F–L) in combination with the specified GAL4. Reduced brain volume was observed following depletion of orb2 by (F) ubiquitous expression via act-GAL4, (G) within neuroepithelia cells of the outer proliferation center via c855a-GAL4, in neural stem cells via (H) wor-GAL4 or (I) insc-GAL4, and in (J) and neurons via elav-GAL4. In contrast, orb2 depletion in (K) mature neurons via brp-GAL4 increased brain size, while (L) brain volume was unaffected in glia using repo-GAL4. (M) Quantification of brain volume normalized to controls, where each dot represents a single measurement from a single optic lobe from N= 30 control, 20 act>orb2RNAi, 25 wor> orb2RNAi, 18 insc>orb2RNAi, 47 elav>orb2RNAi, 27 c855a>orb2RNAi, 12 brp>orb2RNAi, and 25 repo> orb2RNAi pooled from 2 (control, wor, insc, c855a, and repo) or 3 (act, elav, brp) independent biological replicates. Significance was determined by one-way ANOVA. n.s., not significant; *p<0.05; **p<0.01; ***p<0.001; ****p<0.0001. Scale bars: 50 μm.
Figure 2.
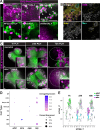
Figure 2.. Orb2 becomes restricted to mature neurons.
(A) Live images of endogenous Orb2-GFP localization relative to a UAS-mCherryNLS reporter (magenta) driven by the indicated GAL4 lines: NSCs (insc), neurons (elavc155), mature neurons (brp), glia (NP2222 and repo), and neuroepithlelial cells (c855a). Dashed circles mark NSCs, asterisks mark glia, and arrows highlight cells positive for both Orb2 and the mCherry reporter; NE, neuroepithelium. (B) Representative immunofluorescence images of third larval instar brains stained for Orb2 (magenta) localization relative to neurons (Elav, yellow) and NSCs (Mira, cyan). Boxed area marks Elav and Orb2-positive neurons. (C) Live images of Orb2 (green) distributions relative to NSCs (insc) or neurons (elav; magenta) throughout the first (1h), second (24h), and third (72h) larval instars; time is hours post larval hatching (PLH). Orb2 exclusion from NSCs (yellow circles) becomes apparent at 24h and 72h PLH. Over time, Orb2 enriches to a subset of elav+ neurons (72h). (D) Seraut dot plot comparing the average expression of the indicated genes (x-axis) across all larval stages relative to known cell type biomarkers (y-axis). (E) UMAP plot of scRNA-seq data (Corrales et al., 2022) comparing cells from the first (1h), second (24h), and third (72h) instar larval brains with normalized expression values of orb2 >3.0 (green), insc >0.75 (cyan), and elav >3.5 (magenta). Scale bars: 10 μm.
Figure 3.
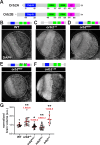
Figure 3.. Multiple Orb2 domains instruct brain size.
(A) Schematic of annotated Orb2 domains: poly-Q domain (glutamine-rich, blue), RNA-recognition motif (RRM, green), and ZZ domain (magenta). (B–G) Representative images of age-matched third larval instar brains of the indicated genotypes stained for DAPI. A schematic of Orb2 structure is shown above each image (astericks denote single AA mutations). (H) Quantification of brain volumes, where each dot represents a single measurement from a single optic lobe from N=13 WT, 25 orb2ΔQ, 32 orb2RBD1*, 30 orb2RBD1/2*, and 9 orb2ΔZZ brains. Data are pooled from 2 (WT, orb2ΔQ, and orb2ΔZZ) or 3 (orb2RBD1* and orb2RBD1/2*) independent biological replicates. Significance was determined by Brown-Forsythe and Welch’s ANOVA (H). *p<0.05; **p<0.01; ***p<0.001. Scale bars: 40 μm.
Figure 4.
Figure 4.. Orb2-mediated translational activation regulates brain size.
(A) Schematic of Orb2 repression and activation complexes when bound to cofactors CG13928 or CG4612 (Khan et. al 2015). Representative images of age-matched no-GAL4 control and act-GAL4 driven (B) CG13928RNAi or (D) CG4612RNAi third instar larval brains stained for DAPI and associated quantification (C and E), where each dot represents a measurement from a single optic lobe from (C) Control, N= 44 and CG13828= 35; (E) Control= 31 and CG4612= 47. Data shown are pooled across three replicates. (F) Immunoblot shows levels of Orb2 relative to the actin loading control from control and CG4612RNAi whole brain extracts, as quantified from triplicated experiments in (G). Significance was determined by Welch’s t-test. n.s., not significant; ***p<0.001; ****p<0.0001. Scale bars: 50 μm. Uncropped blots are available online: https://doi.org/10.6084/m9.figshare.29155505.v1.
Figure 5.
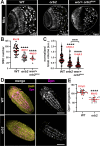
Figure 5.. Orb2 enables NSC specification.
(A) Representative images show NSCs (Mira, greyscale) within age-matched third instar larval brains of the indicated genotypes. (B) Quantification of NSC number from N= 33 WT, 31 orb2, and 9 wor>orb2RNAi brains. (C) Quantification of NSC volume from WT: N=10 brains and n=55 NSCs, orb2: N=10 brains and n=80 NSCs, and wor>orb2RNAi: N=9 brains and n=90 NSCs. For B and C, each dot represents a measurement from a single optic lobe. (D) Stage 11 embryos stained for Dpn (magenta and greyscale) to label neural progenitors and DAPI (yellow). (E) Quantification of embryonic neural progenitors, where each dot represents a measurement from a single embryo from N=28 WT and orb2 embryos. Data are pooled from 2 (B and C) or 3 (E) biological replicates. Significance was determined by Brown-Forsythe and Welch’s ANOVA (B and C) or Welch’s t-test (E). ****p<0.0001. Scale bars: (A) 50 μm and (D) 20 μm.
Figure 6.
Figure 6.. orb2 regulates brain size throughout neurogenesis.
(A) Schematic of the temperature-sensitive depletion of orb2 by RNAi. (B) The temperature shift schemes used in this study: (top row) controls (GAL80TS, UAS-orb2RNAi) were reared at 18°; (middle row) to deplete orb2 activity in embryos (embryo>orb2RNAi), embryos expressing act>GAL4 and GAL80TS, UAS-orb2RNAi were reared at 29°C, then shifted to 18°C 24h PLH; (bottom row) to deplete orb2 activity in larvae (larva>orb2RNAi), embryos expressing the same transgenes were reared at 18° until 24h PLH, then shifted to 29°C. (C) Representative images of age-matched third instar larval brains from controls, embryos raised at the restrictive temperature (embryo>orb2RNAi), and larvae raised at the restrictive temperature (larva>orb2RNAi), as outlined in (B), and stained for DAPI. (D) Quantification shows normalized third instar brain volume from N=39 control, 17 embryo>orb2RNAi, and 15 larva>orb2RNAi brains, where each dot represents a measurement from a single optic lobe. Data shown are pooled from three replicates. (E) Hatch rate analysis of maternal mutant (M−/Z+) versus maternal and zygotic mutant (M−/Z−) orb2 embryos relative to WT, where each dot represents the average across 4 replicates from N=800 WT or orb2 (M−/Z+) and N=820 orb2 (M−/Z−) embryos. Significance was determined by Brown-Forsythe and Welch’s ANOVA. n.s., not significant; *p<0.05; **p<0.01; ***p<0.001; ****p<0.0001. Scale bars: 50 μm.
Figure 7.
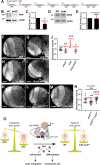
Figure 7.. orb2 is epistatic to brat.
(A) Schematic of conserved CPE sites in the brat 3’UTR. (B) Immunoblot shows Brat protein levels relative to the actin loading control from WT and orb2 whole brain extracts, as quantified from triplicated experiments in (C). (D) Immunoblot showing Orb2 levels are unchanged in brat [fs1/k06028] transheterozygotes relative to WT, as quantified from triplicated experiments in (E). (F–I) Representative images of age-matched third instar larval brains from WT, orb2/+ hemizygote, brat [fs1/k06028], and brat;orb2/+ mutants stained for DAPI. (J) Quantification of brain volume normalized to WT, where each dot represents a single measurement from N=19 WT, 17 orb2/+, 9 brat, and 8 brat;orb2/+ brains. (K–M) Representative images of age-matched third instar larval brains from orb2RNAi control, act>orb2RNAi, and bratOE rescue (act>orb2RNAi and UAS-brat-myc) stained for DAPI. (N) Quantification of brain volume normalized to control, where each dot represents a single measurement from N= 17 control, 21 orb2RNAi, and 29 bratOE brains. Data are pooled from 2 (J) or 3 (N) biological replicates. (O) Proposed model of orb2-regulated brain growth through brat. Loss of orb2 results in smaller brains, while loss of brat causes brain overgrowth. orb2 functions upstream of brat, likely through regulation of Brat translation. Restoring Brat levels is sufficient to rescue improper brain growth in orb2 mutants. Significance was determined by Brown-Forsythe and Welch’s ANOVA or Welch’s t-test (E). n.s., not significant; *p<0.05; **p<0.01; ***p<0.001; ****p<0.0001. Scale bars: 50 μm. Uncropped blots are available online: https://doi.org/10.6084/m9.figshare.29155505.v1.

References

    1. Abdel-Salam G. M. H., Sayed I. S. M., Afifi H. H., Abdel-Ghafar S. F., Abouzaid M. R., Ismail S. I., Aglan M. S., Issa M. Y., El-Bassyouni H. T., El-Kamah G., Effat L. K., Eid M., Zaki M. S., Temtamy S. A., & Abdel-Hamid M. S. (2020). Microcephalic osteodysplastic primordial dwarfism type II: Additional nine patients with implications on phenotype and genotype correlation. Am J Med Genet A, 182(6), 1407–1420. 10.1002/ajmg.a.61585 - DOI - PubMed
    1. Allanson J. E., Cunniff C., Hoyme H. E., McGaughran J., Muenke M., & Neri G. (2009). Elements of morphology: standard terminology for the head and face. Am J Med Genet A, 149a(1), 6–28. 10.1002/ajmg.a.32612 - DOI - PMC - PubMed
    1. Álvarez J. A., & Díaz-Benjumea F. J. (2018). Origin and specification of type II neuroblasts in the Drosophila embryo. Development, 145(7). 10.1242/dev.158394 - DOI - PubMed
    1. Arama E., Dickman D., Kimchie Z., Shearn A., & Lev Z. (2000). Mutations in the β-propeller domain of the Drosophila brain tumor (brat) protein induce neoplasm in the larval brain. Oncogene, 19(33), 3706–3716. 10.1038/sj.onc.1203706 - DOI - PubMed
    1. Ashraf S. I., Hu X., Roote J., & Ip Y. T. (1999). The mesoderm determinant snail collaborates with related zinc-finger proteins to control Drosophila neurogenesis. Embo j, 18(22), 6426–6438. 10.1093/emboj/18.22.6426 - DOI - PMC - PubMed

Publication types

LinkOut - more resources