[Preprint]. 2025 Jul 22:2025.07.20.665707.
doi: 10.1101/2025.07.20.665707.

Functional Connectome of Superagers Reveals Early Markers of Resilience and Vulnerability to Alzheimer's Disease

Affiliations

Functional Connectome of Superagers Reveals Early Markers of Resilience and Vulnerability to Alzheimer's Disease

Kanhao Zhao et al. bioRxiv. .

Abstract

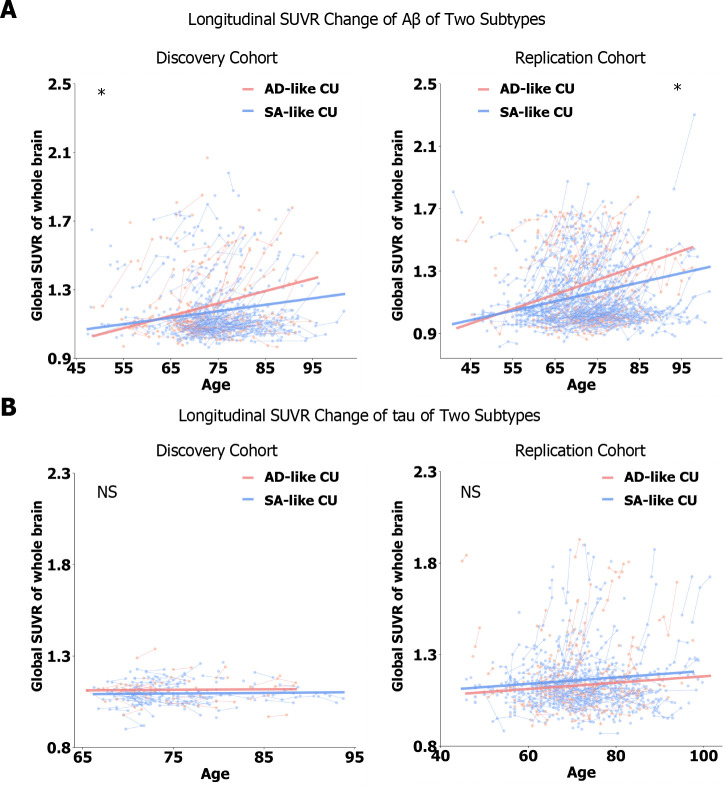
As populations age, identifying the neurobiological basis of cognitive resilience is critical for delaying or preventing Alzheimer's disease (AD). While most older adults experience memory decline, a subset known as superagers (SA) maintains youthful memory into late life, offering a unique window into protective mechanisms against neurodegeneration. Here, we identified a functional connectivity (FC) signature, termed Alzheimer's-resilient connectome (ARC), that robustly differentiates SA from age-matched patients with AD. Using resting-state fMRI in a discovery cohort (N = 290), we identified ARC derived from machine learning classifiers that distinguished SA from AD with high accuracy (AUC = 0.85), and validated the replicability of the ARC in an independent replication cohort (N = 143). ARC involved prefrontal, temporal and insular networks and was strongly associated with brain age. When applied to cognitively unimpaired (CU) adults (discovery cohort: N = 818 and replication cohort: N = 497), ARC-based subtyping revealed SA-like and AD-like subgroups with similar baseline cognitive performance but markedly divergent longitudinal trajectories. SA-like CU individuals showed slower cognitive decline, reduced amyloid-β accumulation, and lower risk of conversion to mild cognitive impairment and AD, reinforcing the ARC signature as a potential early indicator of resilience. Genome-wide association analysis identified CLYBL and FRMD6 as novel genetic modulators associated with these divergent aging phenotypes. Together, our findings position ARC as a sensitive and generalizable biomarker of resilience, enabling early risk stratification and precision prevention for AD.


Conflict of interest statement

Competing Interests G.A.F. received monetary compensation for consulting work for SynapseBio AI and owns equity in Alto Neuroscience. None of the other authors declare any competing interests.

Figures

Figure 1.
Figure 1.. Identification and validation of the Alzheimer’s-resilient connectome (ARC) distinguishing superagers from individuals with AD.
(A) Classification performance in the discovery and replication cohorts. Ten-fold cross-validation in the discovery cohort yielded robust accuracy = 0.80 ± 0.05, sensitivity = 0.74 ± 0.14, specificity = 0.83 ± 0.08, and area under the curve (AUC) = 0.85 ± 0.08. The trained models were then applied to the replication cohort, where predicted labels derived from averaged confidence scores achieved accuracy = 0.71, sensitivity = 0.71, specificity = 0.71, and AUC = 0.72. (B) Discriminative FC signature based on the average weights of the ten cross-validated classifiers. Node strength, defined as the sum of absolute FC classifier weights for each region, is visualized on the brain surface to highlight regions contributing most to classification. (C), (D) ARC signatures that significantly differentiated SA from AD as detected by two-sample t-tests (FDR-corrected p < 0.05) in the discovery and replication cohorts. Hypo-connections (stronger in SA) are colored red, while hyper-connections (stronger in AD) are colored blue. Node strength, derived from summed positive and negative t-values of distinguishing FCs, is visualized on the brain surface. (E) Cross-cohort consistency of ARC signatures. Heatmaps display Kendall’s rank correlation and Dice coefficient. The upper triangular heatmap represents Kendall correlation coefficients (circle box), while the lower triangular heatmap represents Dice coefficients (rectangle box). All the values in the heatmap were significant (p < 0.001).
Figure 2.
Figure 2.. Phenotypic profiles associated with ARC.
The association between various phenotypic indices and the weighted sum of the ARC was examined across SA and AD, forming a comprehensive phenotypic profile. Kendall rank correlation was used to assess relationships with continuous variables, while the Kruskal–Wallis test was applied to categorical variables. For non-demographic variables, Kendall rank correlation analyses were adjusted for age and sex as covariates. FDR correction was applied to all p-values from the discovery and replication cohorts separately, with significance levels denoted as * (pfdr ≤ 0.05), ** (pfdr ≤ 0.01), *** (pfdr ≤ 0.001), and **** (pfdr ≤ 0.0001). (A) Association with demographic variables in the discovery cohort. (B) Association with APOE genotype and cognitive variables in the discovery cohort. (C) Association with demographic variables in the replication cohort. (D) Association with APOE genotype and cognitive variables in the replication cohort.
Figure 3.
Figure 3.. Association between the ARC scores and brain aging in SA and AD.
(A) Brain age prediction performance assessed in the discovery and replication cohorts. A Bayesian ridge regression model was trained using whole-brain FC features from CU individuals in discovery cohort to predict chronological age. Model performance was evaluated using ten-fold cross-validation, and further tested in the replication cohort using cross-validated modals. Predictive accuracy was assessed using R2 and Pearson correlation between predicted brain age and chronological age (discovery cohort: R2 = 0.35, r = 0.60, p = 1.5 × 10−78; replication cohort: R2 = 0.24, r = 0.50, p = 1.4 × 10⁻³²). (B), (C) Correlations between ARC signature scores (z-scored weighted sum of ARC FCs) and predicted brain age versus chronological age across SA and AD individuals. In both the discovery and replication cohorts, predicted brain age was more strongly correlated with ARC signature scores (discovery: τ = 0.44 vs. 0.14; replication: τ = 0.44 vs. 0.15). To enhance statistical power, multiple sessions from the same subject were included, with each dot representing a sample rather than a subject (n = 414 for the discovery cohort, and n = 213 for the replication cohort. Statistical significance was assessed via Kendall rank correlation (used due to non-normal age distributions), and differences between correlation coefficients were confirmed by 1,000 bootstrapping iterations (p < 0.001 for both cohorts). (D) Association between ARC signature scores and brain age gap (BAG), calculated as the difference between predicted brain age and chronological age. ARC was significantly correlated with BAG in both the discovery cohort (τ = 0.41, p = 3.9 × 10−36) and replication cohort (τ = 0.36, p = 2.8 × 10⁻¹⁵). Differences in BAG between SA and AD was tested via two-sample t-tests, with significance levels indicated as ** (p ≤ 0.01), and **** (p ≤ 0.0001).
Figure 4.
Figure 4.. Longitudinal trajectories of characteristic variables for SA-like and AD-like subtypes in both the discovery and replication cohorts.
Linear mixed effect models were used to examine the age-by-subtype interaction effect on various phenotypic variables (excluding demographics). Significant age-by-subtype interaction effects are indicated, showing that this interaction significantly explains variance in the phenotypic trajectories. FDR correction was applied to all p-values. The significance was annotated by * (pfdr ≤ 0.05), ** (pfdr ≤ 0.01), *** (pfdr ≤ 0.001). (A) Longitudinal trajectories in the discovery cohort. (B) Longitudinal trajectories in the replication cohort. Higher scores of CDR and TMT, and lower scores of WAIS Logical Memory and CFT, reflect greater cognitive decline.
Figure 5.
Figure 5.. Longitudinal trajectories of globally expressed neuropathological biomarkers across the whole brain in SA-like and AD-like subtypes in the discovery and replication cohorts.
Standardized uptake value ratio (SUVR) which accounts for variability in radiotracer delivery and clearance, was used to assess Aβ and tau pathology. A linear mixed-effects model was applied to examine the age-by-subtype interaction effect on biomarker expression. The significance was annotated by * (p ≤ 0.05), NS (No significance). (A) Longitudinal procession of Aβ between two subtypes. (B) Longitudinal procession of tau between two subtypes.
Figure 6.
Figure 6.. Manhattan plot of GWAS result associated with the differentiated FCs between AD-like (n = 151) and SA-like (n = 355) subtypes, using a logistic regression model with age, sex, and top five principal components, accounting for population stratification as covariates.
The red horizontal dashed line indicates the genome-wide significant threshold (p = 1 × 10⁻⁵).

References

    1. Tian YE, Cropley V, Maier AB, Lautenschlager NT, Breakspear M, Zalesky A. Heterogeneous aging across multiple organ systems and prediction of chronic disease and mortality. Nat Med. May 2023;29(5):1221–1231. doi: 10.1038/s41591-023-02296-6 - DOI - PubMed
    1. Garo-Pascual M, Zhang L, Valenti-Soler M, Strange BA. Superagers Resist Typical Age-Related White Matter Structural Changes. J Neurosci. Jun 19 2024;44(25)doi: 10.1523/JNEUROSCI.2059-23.2024 - DOI - PMC - PubMed
    1. Mormino EC, Kluth JT, Madison CM, et al. Episodic memory loss is related to hippocampal-mediated beta-amyloid deposition in elderly subjects. Brain. May 2009;132(Pt 5):1310–23. doi: 10.1093/brain/awn320 - DOI - PMC - PubMed
    1. Irish M, Piguet O, Hodges JR, Hornberger M. Common and unique gray matter correlates of episodic memory dysfunction in frontotemporal dementia and Alzheimer’s disease. Hum Brain Mapp. Apr 2014;35(4):1422–35. doi: 10.1002/hbm.22263 - DOI - PMC - PubMed
    1. Jessen F, Wolfsgruber S, Wiese B, et al. AD dementia risk in late MCI, in early MCI, and in subjective memory impairment. Alzheimers Dement. Jan 2014;10(1):76–83. doi: 10.1016/j.jalz.2012.09.017 - DOI - PubMed

Publication types