[Preprint]. 2025 Jul 24:2021.12.29.474455.
doi: 10.1101/2021.12.29.474455.

Adrenergic signaling coordinates distant and local responses to amputation in axolotl

Affiliations

Adrenergic signaling coordinates distant and local responses to amputation in axolotl

Duygu Payzin-Dogru et al. bioRxiv. .

Update in

  • Adrenergic signaling coordinates distant and local responses to amputation in axolotl.
    Payzin-Dogru D, Froitzheim T, Blair SJ, Jena SG, Singer H, Paoli JC, Kim RT, Kriukov E, Wilson SE, Hou R, Savage AM, Cat V, Cammarata LV, Wu SYC, Bothe V, Erdogan B, Hossain S, Lopez N, Losner J, Velazquez Matos J, Min S, Böhm S, Striker AE, Dooling KE, Freedman AH, Groves B, Tajer B, Kalu G, Wynn E, Wong AYL, Fröbisch N, Baranov P, Plikus MV, Buenrostro JD, Haas BJ, Chiu IM, Sackton TB, Whited JL. Payzin-Dogru D, et al. Cell. 2025 Oct 24:S0092-8674(25)01125-0. doi: 10.1016/j.cell.2025.09.025. Online ahead of print. Cell. 2025. PMID: 41138727

Abstract

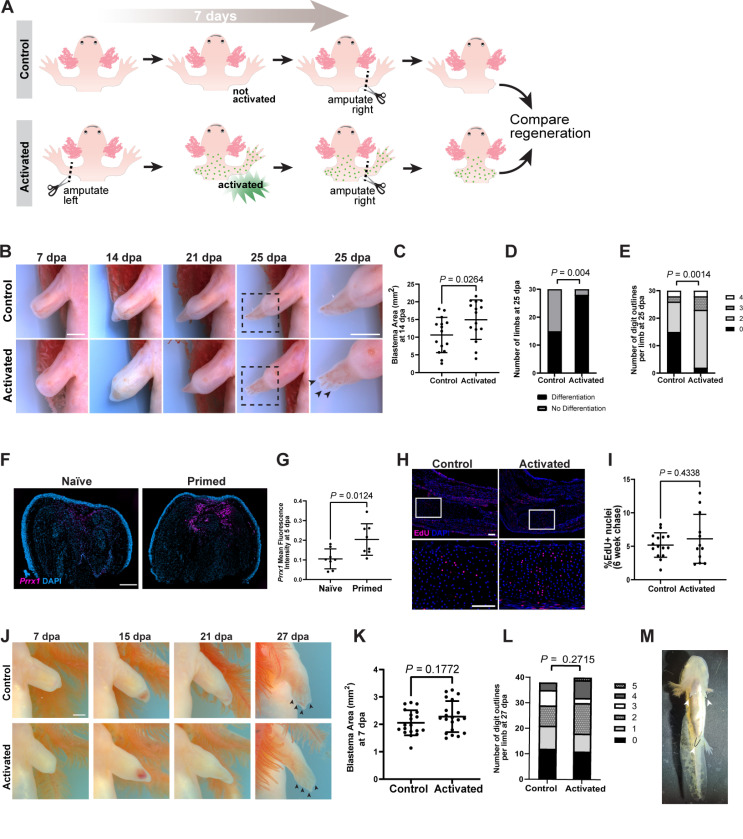
Many species regenerate lost body parts following amputation. Most limb regeneration research has focused on the immediate injury site. Meanwhile, body-wide injury responses remain largely unexplored but may be critical for regeneration. Here, we discovered a role for the sympathetic nervous system in stimulating a body-wide stem cell activation response to amputation that drives enhanced limb regeneration in axolotls. This response is mediated by adrenergic signaling, which coordinates distant cellular activation responses via the α2A-adrenergic receptor, and local regeneration responses via β-adrenergic receptors. Both α2A- and β-adrenergic signaling act upstream of mTOR signaling. Notably, systemically-activated axolotls regenerate limbs faster than naïve animals, suggesting a potential selective advantage in environments where injury from cannibalism or predation is common. This work challenges the predominant view that cellular responses underlying regeneration are confined to the injury site and argues instead for body-wide cellular priming as a foundational step that enables localized tissue regrowth.

Keywords: amputation; limb; mTOR; noradrenaline; norepinephrine; peripheral nervous system; progenitor cells; regeneration; stem cells; systemic responses.


Conflict of interest statement

J.L.W. is a co-founder of Animate Biosciences. I.M.C. consults for GSK Pharmaceuticals, and his lab has received sponsored research from Moderna and AbbVie/Allergan. J.D.B. holds patents related to ATAC-seq, consults for the Treehouse Family Foundation and is a Scientific Advisory Board member of Camp4 and seqWell. M.V.P. is a co-founder of Amplifica Holdings Group, consults for L’Oreal and ODDITY, and his lab has received sponsored research from L’Oreal and AbbVie/Allergan. Other authors declare no competing interests.

Figures

Figure 1.
Figure 1.. Systemically-activated cells are primed for future regeneration events.
(A) Experimental design. We compared regeneration rates of systemically-activated and naïve, control limbs. Green dots, activated, EdU positive nuclei. (B) Representative images of regenerating systemically-activated or control limbs (ventral view). (C-E) Quantification of blastema area at 14 dpa (C), number of differentiating limbs (D), and number of digit outlines (E) at 25 dpa (n=15 animals for each condition in blastema area measurement, n = 30 limbs for each condition in differentiation and digit outline quantification). (F) Prrx1 HCR-FISH was performed on tissue sections at 5 dpa following local amputation of naïve limbs (no previous amputation) and primed limbs (previously amputated on the contralateral side 7 days earlier). (G) Quantification of Prrx1 mean fluorescence intensity across entire tissue sections of naïve and primed blastemas (n = 8 animals for each group). (H) EdU and DAPI staining of intact control limbs (left) and limbs contralateral to amputation (right) harvested 6 weeks after EdU administration. (I) Quantification of percent EdU positive nuclei of intact and contralateral limbs in (H), (n = 15 animals for intact and n = 12 animals for contralateral group). (J) Representative images of systemically-activated and naïve limbs amputated 28 days post-contralateral amputation (ventral view, 7–21 dpa; dorsal view, 27 dpa). (K-L) Quantification of blastema area at 7 dpa (K) and number of digit outlines at 27 dpa (L) (n = 19 animals for control, n = 20 animals for activated for blastema area measurement, n = 38 limbs for control and n = 40 limbs for systemically-activated animals in digit outline quantification). (M) Tiger salamander housed in a near-naturalistic pond simultaneously regenerating three limbs (arrowheads). All data shown as mean ± SD. Statistical significance was determined using unpaired two-tailed Welch’s t-test in (C), (G), (I) and (K); and Fisher’s exact test in (D), and Fisher’s exact test with Freeman-Halton extension in (E) and (L). Scale bars, 2 mm in (B) and (J); 500 μm in (F) and (H). dpa, days post-amputation. EdU, 5-ethynyl-2′- deoxyuridine.
Figure 2.
Figure 2.. PNS at both amputation site and responding site are required for systemic activation.
(A-E) Nerve bundles innervating limbs contralateral to unilateral amputations were transected or sham-operated, and animals were assayed for systemic activation. Animals receiving unilateral denervations or sham-operations with no amputations were used as controls. (A) EdU and DAPI staining of intact and contralateral limb tissue sections of denervated and sham-operated animals in the intact state or at 14 days post-amputation. (B) Quantification of percent EdU positive nuclei in denervated and sham-operated at 14 dpa. (C-E) Breakdown of tissue types represented in (B). (C) Epidermis. (D) Skeletal elements. (E) Internal, non-skeletal tissues. (n = 11 animals for sham, n = 10 animals for denervated, n = 13 animals for sham amputated and denervated amputated), (F-G) Nerve bundles were transected or sham-operated in limbs that were immediately amputated thereafter. (F) EdU and DAPI staining of intact and contralateral limb tissue sections of denervated and sham-operated animals in the intact state or at 14 days post-amputation. (G) Quantification of percent EdU positive nuclei in denervated and sham-operated at 14 dpa (n = 18 animals for sham, n = 16 for sham amputated, n = 11 for denervated, and n = 12 for denervated amputated). (H) Representative image of cross-sectioned sympathetic nerve bundles (stained with a-TH) and EdU+ cells in adjacent tissues in homeostatic (left) and systemically-activated (right) samples. (I) Representative images of cross-sectioned nerve bundles of vehicle and 6-OHDA treated axolotl limbs. (J) EdU and DAPI staining of limbs contralateral to unilateral amputations treated with 6-OHDA or vehicle control, harvested at 14 days post-amputation. (K) Quantification of percent EdU positive nuclei in contralateral limbs in (J) (n = 21 animals for vehicle and n = 20 animals for 6-OHDA groups). (L) Representative regenerating limbs of 6-OHDA and vehicle-treated animals (ventral view). (M) Quantification of blastema area at 14 days post-amputation (n = 21 animals for vehicle and n = 20 animals for 6-OHDA groups). (N) EdU and DAPI staining of regenerating limbs treated with 6-OHDA or vehicle control, harvested at 14 days post-amputation. (O) Quantification of percent EdU positive nuclei in contralateral limbs in (N) (n = 21 animals for vehicle and n = 20 animals for 6-OHDA groups). All data shown as mean ± SD. Statistical significance was determined using unpaired two-tailed Welch’s t-tests with Bonferroni-Dunn correction in (B), (C), (D), (E) and (G), unpaired two-tailed Welch’s t-tests in (K), (M) and (O). Scale bars, 500 μm in (A), (F), (J) and (N), 200 μm in (H), 100 μm in (I), and 2 mm in (L). den, denervated. int, intact. contra, contralateral. 6-OHDA, 6-hydroxydopamine. EdU, 5-ethynyl-2′-deoxyuridine. See also Figure S1.
Figure 3.
Figure 3.. α-Adrenergic signaling is required for systemic activation and priming.
(A) EdU and DAPI staining of regenerating blastemas from animals treated with yohimbine or vehicle control, harvested at 12 days post-amputation. (B) Quantification of percent EdU positive nuclei in blastemas in (A) (n = 20 animals for vehicle, n = 13 animals for yohimbine). (C) EdU and DAPI staining of limbs contralateral to unilateral amputations treated with yohimbine or vehicle control, harvested at 7 days post-amputation. (D) Quantification of percent EdU positive nuclei in contralateral limbs in (D) (n = 15 animals for each group). (E) Experimental design. Animals were treated with chemical agonists or antagonists (treatment) or vehicle solution by daily injections or water treatments starting from 2–3 days before to 7 days post unilateral amputations. The treatments were then ceased, and the uninjured contralateral limbs were unilaterally amputated. The regeneration rates of the second set of amputations were compared between treatment groups. (F) Representative images of regenerating contralateral limbs of yohimbine and vehicle solution-treated animals (ventral view, 5–25 dpa; dorsal view, 32 dpa). (G) Quantification of blastema area at 14 days post-amputation (n=15 animals for each condition). (H) Quantification of the number of digit outlines at 25 days post-amputation (n = 30 limbs for each condition). (I) Representative images of regenerating contralateral limbs of clonidine and vehicle solution-treated animals (ventral view, 7–23 dpa; dorsal view, 33 dpa). (J) Quantification of blastema area at 7 days post-amputation. (n = 20 animals for vehicle and n = 18 animals for clonidine). (K) Quantification of the number of digit outlines at 23 days post-amputation (n = 40 limbs for vehicle and n = 35 limbs for clonidine). The same group of vehicle control animals was used in Figure 4 (I-K). (L-N) Animals were treated with beta-adrenergic receptor antagonist propranolol starting from 2 days before to 7 days post unilateral amputations. (L) EdU and DAPI staining of blastemas and limbs contralateral to unilateral amputations treated with propranolol or vehicle control, harvested at 7 days post-amputation. (M) Quantification of percent EdU positive nuclei within the blastema area of the initially-amputated limbs (n = 15 animals for vehicle and n = 10 for propranolol). (N) Quantification of percent EdU positive nuclei within contralateral limbs at 7 dpa (n = 15 animals for vehicle and n = 10 for propranolol). (O-R) Animals were treated with Adra2a agonist clonidine or vehicle solution starting from 2 days before to 7 days post unilateral amputations. (O) Representative images of regenerating limbs at 7 days post-amputation. (P) Quantification of blastema area at 7 dpa (n = 25 animals for vehicle and n = 20 animals for clonidine). (Q) Representative images of EdU staining of regenerating limbs harvested at 7 days post-amputation. (R) Quantification of percent EdU positive nuclei within the blastema area (n = 15 animals for vehicle and n = 14 for clonidine). All data shown as mean ± SD. Statistical significance was determined unpaired two-tailed Welch’s t-tests in (B), (D), (G), (M), (N), (P) and (R); Welch’s ANOVA with Dunnett’s T3 correction in (J); Fisher’s exact test with Freeman-Halton extension in (H) and (K). Scale bars, 500 μm in (A), (C), (L) and (Q); 2 mm in (F), (I) and (O). hpa, hours post-amputation. dpa, days post-amputation. EdU, 5-ethynyl-2′-deoxyuridine. YOH, yohimbine. See also Figure S2.
Figure 4.
Figure 4.. mTOR signaling is required for systemic activation and priming.
(A) Regenerating limbs at 7 dpa treated with rapamycin or vehicle control. Arrowheads mark the amputation plane. (B) Blastema growth curves of rapamycin or vehicle-treated animals (n = 10 animals per group). Statistical significance was determined using unpaired two-tailed Welch’s t-test with Holm-Šídák correction). (C) Representative skeletal preparations of regenerated limbs with Alcian blue and Alizarin red at 10 weeks post-amputation. (D) EdU and DAPI staining of rapamycin or vehicle-treated blastemas at 14 dpa. Arrowheads mark the amputation plane. (E) Quantification of percent EdU positive nuclei in (D). (F) pS6 and EdU staining of intact (homeostatic) and contralateral limb tissue sections from animals treated with saline, vehicle, or rapamycin at 14 dpa. (G) Quantification EdU positive nuclei at 14 dpa (n = 12 limbs for intact saline, intact vehicle and intact rapamycin groups, n = 10 limbs for amputated saline and amputated vehicle, and n = 8 limbs for amputated rapamycin group). (H) Experimental design to test requirement for mTOR in priming. Animals were treated with rapamycin or vehicle solution by daily injections starting from 3 days before to 7 days post unilateral amputations. The treatments were then ceased, and the uninjured contralateral limbs were unilaterally amputated. The regeneration rates of the second set of amputations were compared between treatment groups. (I) Representative images of regenerating contralateral limbs of rapamycin and vehicle solution-treated animals. (J) Quantification of blastema area at 7 days post-amputation. (K) Quantification of the number of digit outlines at 23 days post-amputation (n=20 animals for vehicle and rapamycin; n = 40 limbs for vehicle and rapamycin for each condition in digit outline quantification). The same group of vehicle control animals were used in Figure 3 (I-K). (L-M) Animals fasting for four weeks were treated with mTORC1 inhibitor rapamycin or vehicle control solution from 2 days before to 14 days post-unilateral amputations. (L) EdU and DAPI staining of limbs contralateral to unilateral amputations from animals treated with rapamycin or vehicle control, harvested at 14 dpa. (M) Quantification of percent EdU positive nuclei in (L). All data shown as mean ± SD. Statistical significance was determined using unpaired two-tailed Welch’s t-test with Holm-Šídák correction in (B); unpaired two-tailed Welch’s t-test in (E) and (M); unpaired two-tailed Welch’s t-test with Bonferroni-Dunn correction in (G); two-tailed Welch’s ANOVA with Dunnett’s T3 correction for multiple hypothesis testing in (J); and Fisher’s exact test with Freeman-Halton extension in (K). Scale bars, 0.5 mm in (A); 500 μm in (D), (F) and (L); 2 mm in (I). rapa, rapamycin. Int, intact. contra, contralateral. dpa, days post-amputation. pS6, phospho-S6 ribosomal protein; EdU, 5-ethynyl-2′-deoxyuridine.
Figure 5.
Figure 5.. Adrenergic signaling operates upstream of mTOR signaling in systemic activation and limb regeneration.
(A) pS6 and DAPI staining of limbs contralateral to amputation from animals treated with yohimbine or vehicle control, harvested at 12 days post-amputation. (B) Quantification of percent pS6 positive cells in limbs in (A) (n = 13 animals for vehicle, n = 15 animals for yohimbine). (C) pS6 and DAPI staining of regenerating blastemas from animals treated with yohimbine or vehicle control, harvested at 12 days post-amputation. (D) Quantification of percent pS6 positive cells in blastemas in (C) (n = 18 animals for vehicle, n = 11 animals for yohimbine). (E) pS6 and DAPI staining of regenerating blastemas from animals treated with propranolol or vehicle control, harvested at 7 days post-amputation. (F) Quantification of percent pS6 positive cells in blastemas in (E) (n = 15 animals for vehicle, n = 11 animals for propranolol). (G) pS6 and DAPI staining of AL-1 cells treated with adrenaline, rapamycin or vehicle solution for 24 hours. (H) Normalized area of positive pS6 signal of AL-1 cells shown in (G). Data shown as mean ± SD. Statistical significance was determined using unpaired two-tailed Welch’s t-tests in (B), (D) and (F); ordinary one-way ANOVA with Dunn-Šidák correction for multiple hypothesis testing in (H). Scale bars, 500 μm in (A), (C) and (E); 50 μm in (G). pS6, phospho-S6 ribosomal protein. dpa, days post-amputation.
Figure 6.
Figure 6.. Systemically-activated cells represent the same broad cell types as cells proliferating during homeostasis and are epigenetically primed.
(A) Experimental design to identify systemically activated cells and compare to proliferating cells during homeostasis. Dividing (4C) and non-dividing (2C) cells of systemically-activated and naïve, control limbs were isolated by sorting dissociated cells according to their DNA content. Each fraction was sequenced separately by single cell RNA-sequencing. (B) Representative FACS distribution following Hoechst stain of homeostatic and systemically-activated limb cell samples. (C) UMAP plot of cells collected from homeostatic control limbs (n = 4) and systemically-activated limbs (n = 4). (D) UMAP plot of cells harvested from homeostatic and activated limbs, with 2C cells colored in red and 4C cells colored in blue (E) UMAP plot of 4C cells with cells harvested from the homeostatic limb in blue and systemically-activated limb in yellow. (F) Dot plot showing the relative frequency of expression (dot size) and expression level (color) for differentially expressed blastema-specific genes across Adra2a+ and Adra2a- cells in homeostatic (H) versus activated (A) samples. (G) Dot plot showing the relative frequency of expression (dot size) and expression level (color) for alpha- and beta- adrenergic receptors in regenerating axolotl limbs (7 timepoints from 3 hpa to 33 dpa combined), sequencing data re-analyzed from Li et al. (H) Marco HCR-FISH on blastema sections of propranolol or vehicle-treated animals (I) Quantification of Marco mean fluorescence intensity across blastema tissue sections of propranolol or vehicle-treated animals at 7 dpa (n = 12 animals vehicle, n = 11 for propranolol groups). (J) Venn diagram illustrating significantly enriched predicted transcription factor binding motifs within open chromatin of each of the three conditions sampled, 4C cells from homeostatic limbs, 4C cells from regenerating limbs (blastema cells), 4C systemically-activated cells. Representative transcription factors are noted, factors directly associated with EMT in green. (K) Dot plot showing the relative frequency of expression (dot size) and expression level (color) for epithelial-mesenchymal transition markers in homeostatic and activated fibroblast clusters. (L) Kazald2 and Snai1 HCR-FISH on homeostatic and activated limb tissue sections. (M) Kazald2 and Snai1 RNAscope-FISH on wholemount homeostatic limbs. All data shown as mean ± SD. Statistical significance was determined using unpaired two-tailed Welch’s t-test in (I). Scale bars, 500 μm in (H) and (L). dpa, days post-amputation. See also Figure S3, S4 and S5, Table S1, S2 and S3 and Supplementary Movie 1.
Figure 7.
Figure 7.. Main findings and implications of the study.
(A) Systemic stem cell activation following amputation promotes faster regeneration. Systemic activation is driven by nerves and requires adrenergic signaling. (B) Two possible models for how systemic activation may promote local limb regeneration. In both models, some limb cells (green nuclei) re-enter the cell cycle (activation) and begin to proliferate in response to amputation. This step is systemic, occurring throughout the body, and common to both models. In the first model (top), some subset of activated progenitor cells later converts to the blastema cell state (blue cells). We postulate this step is local to the site of amputation. The subsequent migration of blastema cells to the distal-most tip of the stump creates a visible blastema (yellow). In the second model (bottom), systemically-activated cells signal to nearby cells to promote functions necessary for blastema formation, which could include dedifferentiation and migration. These models are not mutually exclusive.

References

    1. Johnson K., Bateman J., DiTommaso T., Wong A.Y., and Whited J.L. (2018). Systemic cell cycle activation is induced following complex tissue injury in axolotl. Dev Biol 433, 461–472. 10.1016/j.ydbio.2017.07.010. - DOI - PMC - PubMed
    1. Frobisch N.B., Bickelmann C., and Witzmann F. (2014). Early evolution of limb regeneration in tetrapods: evidence from a 300-million-year-old amphibian. Proceedings. Biological sciences 281, 20141550. 10.1098/rspb.2014.1550. - DOI - PMC - PubMed
    1. Moreno G. (1989). Behavioral and Physiological Differentiation between the Color Morphs of the Salamander, Plethodon cinereus. Journal of Herpetology 23, 335–341. 10.2307/1564043. - DOI
    1. Group, I.S.A.S. (2020). Ambystoma mexicanum. The IUCN Red List of Threatened Species 2020: e.T1095A53947343.
    1. Miller B.T., and Miller J.L. (2005). Prevalence of physical abnormalities in eastern hellbender (Cryptobranchus alleganiensis alleganiensis) populations of Middle Tennessee. Southeastern Naturalist 4, 513–520.

Publication types

LinkOut - more resources