[Preprint]. 2025 Jul 22:2025.07.21.665862.
doi: 10.1101/2025.07.21.665862.

Arrayed single-gene perturbations identify drivers of human anterior neural tube closure

Affiliations

Arrayed single-gene perturbations identify drivers of human anterior neural tube closure

Roya E Huang et al. bioRxiv. .

Abstract

Genetic studies of human embryonic morphogenesis are constrained by ethical and practical challenges, restricting insights into developmental mechanisms and disorders. Human pluripotent stem cell (hPSC)-derived organoids provide a powerful alternative for the study of embryonic morphogenesis. However, screening for genetic drivers of morphogenesis in vitro has been infeasible due to organoid variability and the high costs of performing scaled tissue-wide single-gene perturbations. By overcoming both these limitations, we developed a platform that integrates reproducible organoid morphogenesis with uniform single-gene perturbations, enabling high-throughput arrayed CRISPR interference (CRISPRi) screening in hPSC-derived organoids. To demonstrate the power of this platform, we screened 77 transcription factors in an organoid model of anterior neurulation to identify ZIC2, SOX11, and ZNF521 as essential regulators of neural tube closure. We discovered that ZIC2 and SOX11 are required for closure, while ZNF521 prevents ectopic closure points. Single-cell transcriptomic analysis of perturbed organoids revealed co-regulated gene targets of ZIC2 and SOX11 and an opposing role for ZNF521, suggesting that these transcription factors jointly govern a gene regulatory program driving neural tube closure in the anterior forebrain region. Our single-gene perturbation platform enables high-throughput genetic screening of in vitro models of human embryonic morphogenesis.

Keywords: Stem cell; bioengineering; high-throughput; human; morphogenesis; neural tube; organoids; reproducible.


Conflict of interest statement

Declaration of Interests S.R., G.A., and R.H. are authors on the following patent application, which contains aspects of this work: “Bioengineering and machine learning framework for complex tissue development.” Application serial number PCT/US24/28838.

Figures

Figure 1.
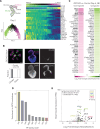
Figure 1.. An in vitro model of human anterior neurulation.
(A) Micrographs of human embryo sections from the Virtual Human Embryo project showing sequential neural plate bending, neural fold elevation, and neural tube closure from Carnegie Stages (CS) 8, 10, and 11. Tissues are outlined according to epithelial thickness, denoting the approximate location of neural ectoderm (green), neural plate border (gray), and surface ectoderm (magenta). Scale bar: 300 μm. (B) Epifluorescence images of seven hexagonally arranged neural tube organoids 1, 2, and 3 days after BMP4 addition, stained for nuclear marker DAPI and neural ectoderm marker N-cadherin (NCAD). Rightmost set of four images shows the organoids at day 4 of differentiation, stained for DAPI, NCAD, and surface ectoderm marker E-cadherin (ECAD). The six outer organoids show radial patterning, with inward-facing neural ectoderm (NCAD+, green) and outward-facing surface ectoderm (ECAD+, magenta). Scale bar: 300 μm. (C) Confocal images of a representative single outer organoid after exposure to BMP4 for 1, 2, 3, and 4 days, fixed and stained for DAPI, NCAD, epithelial tight junction marker ZO-1. A neural plate is distinguishable by Day 2, which elevates and folds from a “U” shape to a “C” shape by Day 3 and finally fuses on Day 4 to enclose a single lumen (“O” shape). Scale bar: 100 μm. (D) Quantification of neural tube closure in Day 4 organoids (left) and relative proportion of ECAD+ surface ectoderm to NCAD+ neural ectoderm (right) as measured by the projected area (see Methods). 100% of the outer organoids across biological replicates (N=4 replicates, n=24 organoids) exhibit closure based on observation of a continuous ring of NCAD (Figure S1F). The ratio of the surface to neural ectoderm has a coefficient of variation (CV) of 0.01. E) Quantification of lumen (left) and organoid size (right) across Day 4 organoids (n=6), based on the projected area enclosed by NCAD and DAPI staining (Methods). Lumen and organoid size have a CV of 0.09 and 0.04, respectively. F) Hierarchical clustering in the space of genes identified by sparse multimodal decomposition (Methods) of single-cell RNA-sequencing data from organoids on Day 2 after BMP4 addition (left) and Week 4 human embryos (right), showing the existence of neural ectoderm (green), neural plate border (gray) and surface ectoderm (magenta) cell types in vitro and in vivo marked by similar gene expression patterns. Distinct sets of transcription factors are enriched in neural and surface ectoderm, highlighted in green and magenta respectively, and a subset of these are co-expressed in border ectoderm. Neural ectoderm cells express high levels of forebrain-associated transcription factors (OTX1, OTX2, LHX2, SIX3), and low levels of midbrain/hindbrain-(EN1, EN2) or ventral forebrain-(NKX2-1, GSX2) associated transcription factors. Gene expression (color bar, bottom left) is normalized to median transcript count, followed by log- and min-max normalization.
Figure 2.
Figure 2.. Identifying transcription factor candidates regulating anterior neurulation.
A) Top left: Illustration denoting the mediolateral axis present in neural tube organoids, spanning the dorsal neural ectoderm, neural plate border, and surface ectoderm. Bottom left: Principal component analysis of single-cell RNA-sequencing (scRNA-seq) data from Day 2 organoids, colored by pseudo-spatial mediolateral coordinate. Right: Standardized mediolateral expression profiles of NCAD, ECAD, and 20 most medially expressed transcription factors from Day 2 organoids. Mediolateral coordinate is denoted by the green-magenta color bar (top) and expression is denoted by the blue-yellow color bar (bottom left). B) Day 4 organoids transduced with a dual-guide RNA targeting ZIC2. Top left: Epifluorescence merged-channel image of organoids on the pattern stained for NCAD and ECAD. Scale bar: 300 μm. Right: Confocal image of one organoid stained for NCAD, ECAD, and DAPI. Scale bar: 100 μm. Bottom left: Quantification of neural tube closure in Day 4 control and ZIC2 knockdown (KD) organoids, showing that 0% of the control and 100% of ZIC2 knockdown organoids possess an open neural plate. C) Top 40 up- and down-regulated genes in the neural ectoderm (NE) of Day 4 organoids upon ZIC2 knockdown as compared to scramble control, based on log2(fold change) (color bar, bottom). Transcription factors highlighted in bold. D) Histogram of enrichment scores based on MEME SEA (Methods) of most overrepresented transcription factor family motifs in regulatory regions 10kb upstream and 100bp downstream of transcriptional start sites for the most down-regulated genes upon ZIC2 knockdown, using a threshold of log2(mean fold change relative to scramble control) < −0.4. Families are color-coded if a transcription factor from that family is present in our candidate selection (Figure 2E). E) Plot of mean expression in neural ectoderm (transcripts per million, TPM) versus log2(fold change) in their expression between the neural and surface ectoderm in Day 2 organoids for all transcription factors (n=1482). Top 20 most medially expressed transcription factors (black or black outline) and additional candidates (gray, n=58) selected for knockdown (n=78, total). Data points corresponding to members of TF family with enrichment of binding sites near ZIC2-regulated genes (D, Methods) are colored by family membership. All 78 candidates are listed in Figure S2F.
Figure 3.
Figure 3.. High-throughput method for arrayed single-gene perturbations.
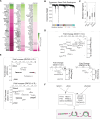
(A) Top: Schematic of pooled perturbations (as generated in previous work) that result in a mosaic organoid, in which a distinct sub-population of cells are perturbed by each guide RNA (shown in different colors). These mosaic organoids can be dissociated for single-cell transcriptomics. Bottom: Schematic of arrayed perturbations (generated in this work) that result in homogeneously perturbed organoids: all cells in each set of organoids are perturbed by the same guide (distinct guides shown in different colors). These organoids can be screened for morphological defects and subsequently dissociated and pooled for single cell transcriptomics. (B) Efficiency measurements of transduction protocols. Representative images (left) and quantifications (right) correspond to the following protocols. Protocol 1: Virus added 24 hours after seeding and incubated for 24 hours. Protocol 2: Virus added 24 hours after seeding and incubated for 1 hour. Protocol 3: Virus added 1 hour after seeding and incubated for 24 hours. Protocol 4: Virus added 1 hour after seeding and incubated for 1 hour. Protocol 5: Virus added during seeding and incubated for 1 hour. See Figure S3D for transduction efficiency calculation. (C) Correlation measurement of transduction and knockdown efficiencies. Left: Representative images of circular micropatterns show increasing transduction efficiency (mCerulean, mCer) and decreasing OCT4 expression with increasing viral volume of virus (volumes displayed left of each row) carrying a transfer plasmid with dual guides targeting OCT4, added to 150,000 hPSCs during seeding. Scale bar: 300 μm. Middle: Quantification of nuclear OCT4 fluorescence of individual cells in each condition. Dotted line (threshold) indicates 95th percentile value of OCT4 fluorescence in mCer− cells. Right top inset in each plot is the percentage of mCer+ cells with OCT4 fluorescence above the threshold, indicating OCT4 retention. Right: Plot of percentage of cells showing OCT4 knockdown vs. percentage of cells that express mCer expressed by the guide plasmid show a positive correlation (R2=0.99) demonstrating that live mCer fluorescence coverage of a micropattern is an accurate indicator of percentage of cells transduced. (D) Schematic of small-volume viral growth and 24-well organoid chip seeding. Dual gRNA plasmids are first arrayed in a 96-well plate. Different colors represent unique lentiviral transfer plasmids targeting different genes (Figure S2B). HEK cells are transfected in a 96-well plate to form an arrayed viral library, then applied to a glass coverslip containing micropatterned hPSCs (depicted with blue dots) using a temporary well system (depicted in dark gray). The well system is then removed, resulting in a glass chip with 24 sets of differently perturbed organoids, each with multiple replicates, that can be cultured in a single media condition. (E) Left: Quantifications of mCer fluorescence coverage of micropatterns in a mock-transduced well without virus (Well 1, 5% median mCer fluorescence coverage, n=16 micropatterns per well) and 23 scramble vector-transduced wells (Wells 2–24, 99% median mCer fluorescence coverage across wells, n=16 micropatterns per well). See Figure S3D for calculation. Right: Stitched images of viral transduction of micropatterns in Wells 1–6. Transduction efficiency across wells is high and consistent, with a low cross-contamination rate. Scale bar: 300 μm.
Figure 4.
Figure 4.. SOX11, ZIC2 and ZNF521 are necessary for neural tube closure
(A) Phenotypic scores of organoids knocked down with each gene. Scoring was based on whether organoids had no closure defects (score = 0, white), a minor defect (score = 1, gray), or a major defect (score = 2, black) consisting of either a fully opened neural plate or multiple closure points. (B) Epifluorescence microscopy of organoids at Day 4 (unless otherwise noted), showing examples of no defect (top row, scrambled control), minor defect scores (HESX1 knockdown, row 2), or major defect scores (ZIC2, SOX11 and ZNF521 knockdown, rows 3–5 respectively). Three biological replicates per condition are shown with n=6 outer organoids per replicate. Imaging of HESX1 knockdown organoids with a minor defect on Day 5 show that most of them eventually close and that minor openings represent delayed closure. Scale bar: 300 μm. (C) Corresponding confocal images of single organoids for each of the phenotype classes in (B), showing a range of closure phenotypes. Scale bar: 100 μm.
Figure 5.
Figure 5.. SOX11 and ZIC2 co-regulate a shared set of genes in opposition to ZNF521.
(A) Fold changes of the 40 most up- or down-regulated genes in the neural ectoderm of each knockdown condition at Day 4, as compared to organoids transduced with a scramble control guide. Genes that are co-downregulated by SOX11 and ZIC2 knockdown are shown in bold. (B) Cluster dendrogram of WGCNA analysis of scRNA-seq gene expression from neural cells (scramble control) showing modules of co-expressed genes. Module assignment (numbered) is indicated by the color bar; genes labeled in gray were not assigned. (C) Module eigengene values (representative first principal component of expression of genes in a module) of Module 9 per cell in the neural cell population in each knockdown condition compared to scramble control data. SOX11 knockdown leads to significant downregulation of genes in Module 9 (p < 0.0001), which includes ZIC2 (Fig. S2D). (D) Scatterplots showing fold changes of significantly co-downregulated genes (Anderson Darling test, p<0.05) in the neural cell populations from transcription factor knockdown pairs, as compared to organoids transduced with a scramble control guide. Genes are plotted if their fold change expression (FC) relative to scrambled control passes the threshold log2(FC) <−0.4 in both knockdown conditions. Genes are labeled if log2(FC) <−0.6 in both conditions. (E) Scatterplots showing fold changes of genes that are significantly downregulated (Anderson Darling test, p<0.05) by ZIC2 or SOX11 knockdown and significantly upregulated by ZNF521 knockdown, as compared to organoids transduced with a scramble control guide. (F) Gene regulatory model: SOX11 and ZIC2 are upstream a similar set of genes, including neural tube defect candidates from the literature like PAX2, HESX1, and CRABP1. ZNF521 upregulates a separate set of genes but downregulates several shared ZIC2- and SOX11-upregulated genes.

References

    1. Nüsslein-Volhard C., and Wieschaus E. (1980). Mutations affecting segment number and polarity in Drosophila. Nature 287, 795–801. 10.1038/287795a0. - DOI - PubMed
    1. Nüsslein-Volhard C. (2012). The zebrafish issue of Development. Development 139, 4099–4103. 10.1242/dev.085217. - DOI - PubMed
    1. Aguilera-Castrejon A., Oldak B., Shani T., Ghanem N., Itzkovich C., Slomovich S., Tarazi S., Bayerl J., Chugaeva V., Ayyash M., et al. (2021). Ex utero mouse embryogenesis from pre-gastrulation to late organogenesis. Nature 593, 119–124. 10.1038/s41586-021-03416-3. - DOI - PubMed
    1. Justice M.J., and Dhillon P. (2016). Using the mouse to model human disease: increasing validity and reproducibility. Dis Model Mech 9, 101–103. 10.1242/dmm.024547. - DOI - PMC - PubMed
    1. Skarnes W.C., Rosen B., West A.P., Koutsourakis M., Bushell W., Iyer V., Mujica A.O., Thomas M., Harrow J., Cox T., et al. (2011). A conditional knockout resource for the genome-wide study of mouse gene function. Nature 474, 337–342. 10.1038/nature10163. - DOI - PMC - PubMed

Publication types

LinkOut - more resources