[Preprint]. 2025 Jul 22:2025.07.22.665939.
doi: 10.1101/2025.07.22.665939.

Mapping mesenchymal diversity in the developing human intestine and organoids

Affiliations

Mapping mesenchymal diversity in the developing human intestine and organoids

Kelli F Johnson et al. bioRxiv. .

Abstract

The organization of diverse mesenchymal populations during human intestinal development is critical for tissue architecture and function yet remains poorly defined. To construct a comprehensive, tissue-scale map of the developing human small intestine, we leveraged single-cell RNA-sequencing data to build a custom Xenium spatial transcriptomics gene panel covering the diversity of cell types in the human intestine. Analysis was focused on the developing mesenchyme populations (also referred to as fibroblasts or stroma) given the lack of spatiotemporal information about these cell populations. We defined 5 broad mesenchymal populations occupying discrete anatomical locations within the lamina propria and submucosa - the subepithelial cells (SEC), lamina propria fibroblasts (LPF), submucosal fibroblasts (SMF), smooth muscle cells (SMC), and CXCL13+ fibroblasts. Our data reveal dynamic spatial remodeling of fibroblast communities during development and establish molecular markers to distinguish these populations. We leverage this high-resolution atlas to benchmark pluripotent stem cell-derived human intestinal organoids and to demonstrate how this foundational resource can be used to dissect intestinal stromal signaling in a spatial manner, with broad implications for modeling development, regeneration, and disease.

Keywords: Xenium; development; fibroblast; human; intestine; mesenchyme; single-cell sequencing; spatial transcriptomics.


Figures

Figure 1:
Figure 1:. Comparison of major cell type class composition between scRNAseq and Xenium datasets describing the human fetal small intestine
UMAP projections summarizing the major cell classes observed in human fetal small intestine as determined by A) scRNAseq and C) Xenium spatial transcriptomics. Stacked bar graphs describing the cell population composition of the human fetal small intestine at various time points through development (47–142 DPC) for either the B) scRNAseq dataset or D) Xenium dataset. Sample labels below the graphs in B and D are colored to indicate the developmental stage (DPC) each sample falls within. The number of cells included in each sample is indicated below the sample age. E-G depict the 105 DPC human fetal duodenum as a representative Xenium image set example. E) The DAPI image of the complete Xenium 105 DPC sample. Scalebar = 1000μm. The white box outlines the region depicted in F. F) A digital cell mask depicting the distribution of the major cell classes annotated in C. Scalebar = 500μm. The white box indicates the region depicted in G. G) An example of cell sub-type distribution within each major cell class identified using the Xenium panel visualized with each color representing distinct sub-types: G1) the epithelium sub-types, G2) the fibroblast sub-types, G3) the SMC-related sub-types, G4) the ENS sub-types, G5) the endothelium sub-types, and G6) the immune sub-types. Scalebar = 100μm. Cell populations are color matched in A-F; epithelium (gold), fibroblasts (navy), muscularis mucosa (MM, light green), other SMCs (dark green), ENS (yellow), endothelium (cyan), and immune (pink). DAPI staining of cell nuclei depicted in grey.
Figure 2:
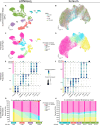
Figure 2:. Identification of diverse fibroblast populations within the developing intestine using scRNA-seq and Xenium
UMAP projections summarizing the extracted fibroblast populations observed in human fetal small intestine as determined by A) scRNAseq and B) Xenium spatial transcriptomics, pseudo-colored by developmental stage. C) scRNAseq and D) Xenium UMAPs pseudo-colored colored by cell type. Dot plots displaying the markers used to annotate individual clusters for the E) scRNAseq and F) Xenium data. Stacked bar graphs describing the fibroblast cell population composition of the human fetal small intestine at various time points through development (47–142 DPC) for either the G) scRNAeq dataset or H) Xenium dataset. Sample labels below the graphs in G-H are colored to indicate the developmental stage (DPC) each sample falls within. The number of fibroblast cells included in each sample is indicated below the sample age. Cell populations are color matched in C-H; SECs (yellow), early LPFs (mint green), co-expressing LPFs (light teal), late LPFs (cyan), SMFs (pink), and CXCL13+ Fibroblasts (red).
Figure 3:
Figure 3:. Localization of fibroblast sub-populations using Xenium spatial transcriptomics
Expression of proposed human fetal intestinal fibroblast markers over developmental time in the duodenum. A) Landmark populations of the muscularis externa and muscularis mucosa (green), epithelium (orange), fibroblasts (navy), endothelium (cyan), ENS (yellow), and immune cells (pink) are provided for localization reference. Fibroblast populations identified in the sequencing data include B) SEC (yellow), C) FABP5+ early LPF (mint green), D) ADAMDEC1+ LPF (cyan), E) SHISA3 (pink), F) CXCL13+ fibroblast (red). White dots indicate the expression of the indicated marker transcript. G) Composite mask displaying all fibroblast cell types. Scale bars = 50–100μm. Colored bars indicate the developmental stage (DPC) each sample falls within. DAPI depicted in grey in A and G.
Figure 4:
Figure 4:. Identification and comparison of EGF-tHIO and EREG-tHIO major cell class composition
UMAP projections of the major cell class composition in a Xenium image of both an A) EGF-tHIO and B) EREG-tHIO. C) Stacked bar graph summarizing the percent cellular composition of the EGF-tHIO (left) and EREG-tHIO (right) samples. Cell ID masks generated in XE depicting 1) the entire sample acquired for the D) EGF-tHIO and E) EREG-tHIO. Scale bar = 5000μm. The white box indicates the ROI depicted in D2/E2-D7/E7. D2–7 and E2–7 display the cell sub-type distribution of each major cell class identified using the Xenium panel visualized as 2) the major cell class mask, 3) the epithelium sub-types, 4) the fibroblast sub-types, 5) the SMC-related sub-types, 6) the ENS sub-types, and 7) the endothelium sub-types. Scale bar = 500μm Cell classes are color matched in A-E; epithelium (gold), fibroblasts (navy), muscularis mucosa (MM, light green), SMC and pericytes (dark green), ENS (yellow), and endothelium (cyan). No immune cells were observed in either tHIO sample. DAPI staining of cell nuclei depicted in grey.
Figure 5:
Figure 5:. Fibroblast populations within tHIOs mimics distribution within human tissue
UMAP projections of the fibroblast cell class composition in a Xenium image of both an A) EGF-tHIO and B) EREG-tHIO. C) Stacked bar graph summarizing the percent cellular composition of the EGF-tHIO (left) and EREG-tHIO (right) samples. Cell ID masks generated in XE depicting D) EGF-tHIO and E) EREG-tHIO samples. 1) XE cell mask summarizing the major cell classes for the tHIOs to landmark fibroblast population locations. Fibroblast sub-type distribution is depicted as 2) the F3+ SECs, 3) the FABP5+ early LPFs, 4) the ADAMDEC1+ late LPFs, 5) the SHISA3+ SMFs, and 6) the CXCL13+ Fibroblasts. 7) depicts the composite mask summarizing all fibroblast cell types in the tHIOs. Scale bars = 100μm
Figure 6:
Figure 6:. Summary of adult duodenum major cell class and fibroblast composition
UMAP projections of A) the major cell class composition and F) the fibroblast composition in a Xenium image of a full thickness cross-section of adult (44yo, female) duodenum. Stacked bar graphs summarizing the percent cellular composition of B) the major cell classes and G) the fibroblast cell types. Total cell number is included below the graphs. C-E and H-J) Cell ID masks generated in XE depicting C) major populations and H) fibroblasts for the entire sample acquired for the adult duodenum; scale bar = 2000μm. D and H) Magnified ROI indicated in C and H; scalebar = 1000μm. E and J) Magnification of the crypt-villus axis to visualize the lamina propria composition; scale bar = 200μm. Cell classes are color matched in A-E; epithelium (gold), fibroblasts (navy), muscularis mucosa (MM, light green), SMCs (dark green), ENS (yellow), endothelium (cyan), and immune cells (pink). DAPI staining of cell nuclei depicted in grey. Fibroblast populations are color matched in F-J; SEC (yellow), LPF (cyan), SMF (pink), and CXCL13+ fibroblasts (red).
Figure 7:
Figure 7:. Schematic of human small intestinal fibroblast localization
Distribution of fibroblast populations identified by scRNAseq of human fetal small intestine. Fibroblast sub-types have distinct localizations: SEC (yellow) form a single cell layer adjacent to the epithelium, LPF (cyan) populate the remainder of the lamina propria, SMF (pink) populate the sub-mucosa, and CXCL13+ fibroblasts (red) are found rarely within the SEC layer, usually at the crypt neck/villus shelf cupping a single crypt. Image includes epithelial cells (grey), SMC –muscularis mucosa (light green), and SMC – muscularis externa (dark green) for reference.

References

    1. Holloway E.M., Czerwinski M., Tsai Y.H., Wu J.H., Wu A., Childs C.J., Walton K.D., Sweet C.W., Yu Q., Glass I., et al. (2021). Mapping Development of the Human Intestinal Niche at Single-Cell Resolution. Cell Stem Cell 28, 568–580 e564. 10.1016/j.stem.2020.11.008. - DOI - PMC - PubMed
    1. Elmentaite R., Kumasaka N., Roberts K., Fleming A., Dann E., King H.W., Kleshchevnikov V., Dabrowska M., Pritchard S., Bolt L., et al. (2021). Cells of the human intestinal tract mapped across space and time. Nature 597, 250–255. 10.1038/s41586-021-03852-1. - DOI - PMC - PubMed
    1. Elmentaite R., Ross A.D.B., Roberts K., James K.R., Ortmann D., Gomes T., Nayak K., Tuck L., Pritchard S., Bayraktar O.A., et al. (2020). Single-Cell Sequencing of Developing Human Gut Reveals Transcriptional Links to Childhood Crohn’s Disease. Dev Cell 55, 771–783 e775. 10.1016/j.devcel.2020.11.010. - DOI - PMC - PubMed
    1. Oliver A.J., Huang N., Bartolome-Casado R., Li R., Koplev S., Nilsen H.R., Moy M., Cakir B., Polanski K., Gudiño V., et al. (2024). Single-cell integration reveals metaplasia in inflammatory gut diseases. Nature 635, 699–707. 10.1038/s41586-024-07571-1. - DOI - PMC - PubMed
    1. Yu Q., Kilik U., Holloway E.M., Tsai Y.H., Harmel C., Wu A., Wu J.H., Czerwinski M., Childs C.J., He Z., et al. (2021). Charting human development using a multi-endodermal organ atlas and organoid models. Cell 184, 3281–3298 e3222. 10.1016/j.cell.2021.04.028. - DOI - PMC - PubMed

Publication types

LinkOut - more resources