[Preprint]. 2025 Jul 22:2024.10.14.618195.
doi: 10.1101/2024.10.14.618195.

Chemically modified CRISPR-Cas9 enables targeting of individual G-quadruplex and i-motif structures, revealing ligand-dependent transcriptional perturbation

Affiliations

Chemically modified CRISPR-Cas9 enables targeting of individual G-quadruplex and i-motif structures, revealing ligand-dependent transcriptional perturbation

Sabrina Pia Nuccio et al. bioRxiv. .

Abstract

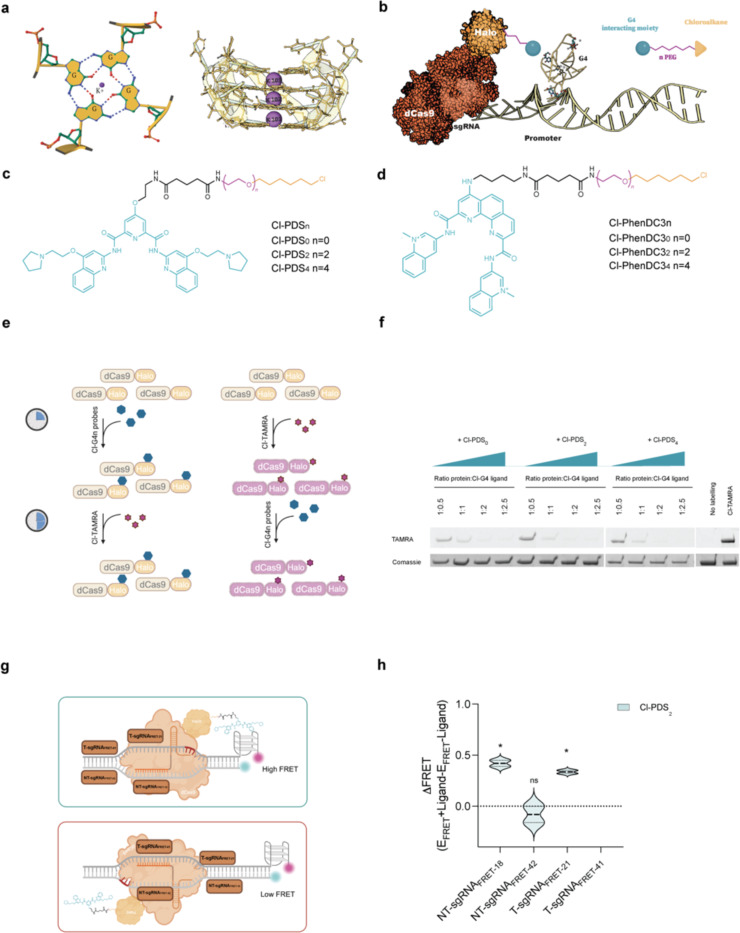
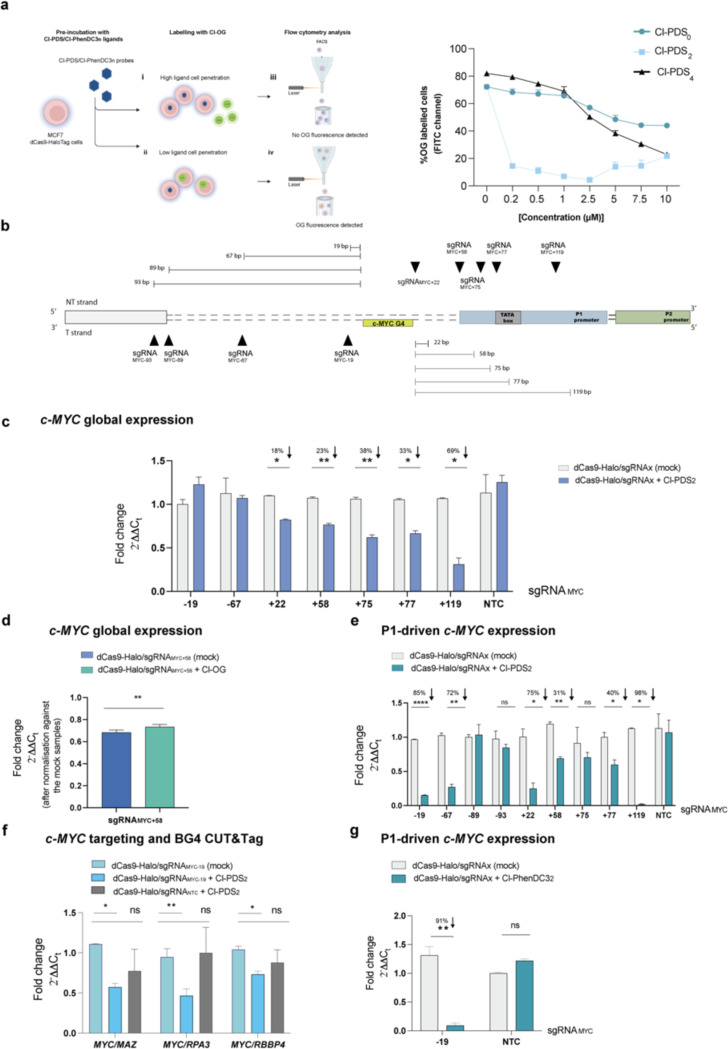
The development of selective ligands to target DNA G-quadruplexes (G4s) and i-motifs (iMs) has revealed their relevance in transcriptional regulation. However, most of these ligands are unable to target individual G4s or iMs in the genome, severely limiting their scope. Herein, we describe a new Approach to Target Exact Nucleic Acid alternative structures (ATENA) that relies on the chemical conjugation of established G4 and iM ligands to a catalytically inactive Cas9 protein (dCas9), enabling their individual targeting in living cells. ATENA demonstrated that the selective targeting of the G4 present in the oncogene c-MYC leads to the suppression of transcripts regulated exclusively by one of its promoters (P1). Conversely, targeting the c-MYC iMs on the opposite strand leads to the selective increase of P1-driven transcripts. ATENA revealed that G4-mediated transcriptional responses are highly ligand-specific, with different ligands eliciting markedly different effects at the same G4-site. We further demonstrated that the basal expression levels of the gene targeted can be used to predict the transcriptional impact associated with G4-stabilization. Our study provides an innovative platform to investigate G4- and iM-biology with high precision and unveils the therapeutic relevance of individual DNA structures with unprecedented selectivity.


Figures

Figure 1:
Figure 1:. Chemical labeling of dCas9 for selective G4-targeting.
a, Schematic representation of a G-Tetrad via Hoogsteen base pairing with central cation (K+) (modified from PDB file:6W9P) (Left) and G-Tetrad stacking to form G4-structure (modified from PDB file:6W9P using Protein Imager ). (Right). b, Schematic overview of ATENA: dCas9-Halo fusion protein functionalized with chloroalkane-modified G4-ligands enables single G4-targeting through sgRNA guidance. c, Chemical structure of chloroalkane-modified PyPDS, where n indicates the different PEG linker lengths (Cl-PDSn). d, Chemical structure of chloroalkane-modified PhenDC3 (Cl-PhenDC3n), where n indicates the different PEG linker lengths (Cl-PhenDC3n). e, Illustration of the competition assay workflow to test the binding ability of Cl-PDSn probes to dCas9-Halo purified recombinant protein. f, SDS-Page gel of the Cl-PDSn competition assay shows each sample’s fluorescent level acquired in the TAMRA channel (542 nm) and the corresponding protein level (Coomassie staining): (n=2). g, Schematic representation of the dually labeled FRET oligos containing c-KIT2-G4 forming sequence bound by dCas9-Halo labeled with Cl-PDSn probes to study G4 stabilization with respect to the PEG-linker length and sgRNA positioning. h, ΔFRET efficiency of the decorated dCas9-PDS (with Cl-PDS2) complex targeting c-KIT2-G4. The values indicated were extrapolated from the band intensity measured in the Cy3 and Cy5 channels (Typhoon FLA 9500). The signals in both channels were normalized for the background and the sgRNA NTC control. These normalized fluorescence values were then used to calculate the ΔFRET efficiency for each sgRNA: FRET-Efficiency (E)+ligand sgRNAx – FRET-Efficiency (E)-ligand sgRNAx (n=2). Data presented are the mean of n = number of independent experiments. Statistical significance was calculated using a two-tailed t-test in GraphPad Prism; p-value: ns > 0.05, * ≤0.05, ** ≤0.01, *** ≤0.001, **** ≤0.0001.
Figure 2:
Figure 2:. ATENA enables selective targeting of a G4 in the c-MYC promoter.
a, (left) Schematic representation of the CAPA assay; (i) high probe cell penetration/reactivity results in Cl-OG inability to bind the HaloTag, conversely (ii) low probe cell penetration/reactivity allows Cl-OG to bind the HaloTag, resulting respectively in (iii) no Oregon Green fluorescence detected via Flow cytometry or (iv) presence of Oregon Green fluorescence signal in the FITC channel. (right) CAPA assay curves of Oregon Green fluorescence signal obtained upon treatment of MCF7 cells stably expressing dCas9-Halo with Cl-PDSn followed by fluorophore incubation (n=2). Flow cytometry was performed using Attune NxT Flow cytometer (FITC channel), and data were then analyzed with FlowJo software. b, Schematic illustration of the c-MYC promoter with the annotated G4 (MYC-G4), sgRNA targeting region (black triangles), and their relative distance in bp from the MYC-G4. c, RT-qPCR for c-MYC expression in MCF7 cells stably expressing dCas9-Halo transfected with the indicated sgRNAs and incubated for 48h in the presence of (2.5 μM) Cl-PDS2 or DMSO (mock). The expression values are represented as fold change (2-ΔΔCt) with respect to the mock (DMSO-treated) and normalized for the housekeeping gene GAPDH. n=3, biological replicates, each with three technical replicates. d, RT-qPCR for c-MYC expression in MCF7 cells stably expressing dCas9-Halo transfected with sgRNAMYC+58 and incubated for 24h in the presence of either Cl-PDS2 (2.5 μM) or Cl-OG (5 μM). The expression values are represented as fold change (2-ΔΔCt) with respect to the mock (DMSO-treated) and normalized for the housekeeping gene GAPDH. n=2, biological replicates, each with two technical replicates. e, RT-qPCR for P1-driven c-MYC expression in MCF7 cells stably expressing dCas9-Halo transfected with the indicated sgRNAs and incubated for 48h in the presence of (2.5 μM) Cl-PDS2. The expression values are represented as fold change (2-ΔΔCt) with respect to the mock (DMSO-treated) and normalized for the housekeeping gene GAPDH. n=3, biological replicates, each with three technical replicates. f, BG4 CUT&Tag-qPCR for MCF7 cells stably expressing dCas9-Halo transfected with either sgRNAMYC-19 or sgRNA NTC and treated with DMSO (mock) or (2.5 μM) Cl-PDS2. BG4 accessibility was analyzed for c-MYC and normalized to three G4s in control gene sites (RPA3, MAZ, RBBP4). n=2, biological replicates, each with three technical replicates for BG4 and one for the negative (no BG4 treatment). g, RT-qPCR for P1-dependent c-MYC expression in MCF7 cells stably expressing dCas9-Halo transfected with sgRNAMYC-19 or sgRNA NTC and incubated for 48h in the presence of (2.5 μM) Cl-PhenDC32. The expression values are represented as fold change (2-ΔΔCt) with respect to the mock (DMSO-treated) and normalized for the housekeeping gene GAPDH. n=3, biological replicates, each with two technical replicates. Data presented are the mean of n = number of independent biological samples. Statistical significance was calculated using a Welch-corrected two-tailed t-test in GraphPad Prism; p-value: ns > 0.05, * ≤0.05, ** ≤0.01, *** ≤0.001, **** ≤0.0001.
Figure 3:
Figure 3:. The selective G4-MYC ligand DC-34 matches ATENA.
a, Chemical structure of DC-34. b, RT-qPCR for c-MYC expression in MCF7 cells treated with increasing concentration of DC-34 for 48h. Values are represented as fold change (2-ΔΔCt) with respect to the mock (DMSO-treated) and normalized for the housekeeping gene GAPDH. n=3, biological replicates, each of which included two technical replicates. c, RT-qPCR for P1-driven c-MYC expression in MCF7 cells treated with different concentrations of DC-34 for 48h. Values are represented as fold change (2-ΔΔCt) with respect to the mock (DMSO-treated) and normalized for the housekeeping gene GAPDH. n=3, biological replicates, each of which included two technical replicates. d, Evaluation of potential DC-34 off-targets by analyzing the KRAS expression using the same samples reported in c. e, BG4 CUT&Tag-qPCR for MCF7 cells treated with DMSO (mock) or (7.5 μM) DC-34. BG4 accessibility was analyzed for c-MYC and normalized to three G4s in control gene sites (RPA3, MAZ, RBBP4). n=2, biological replicates, including three technical replicates for BG4 and one for the negative (no BG4 treatment). f, Volcano plot of DEGs in MCF7 cells treated with DC-34 vs cells treated with DMSO (mock). Gray = non-significant genes (FDR ≥ 0.05 or |log2FC| < 1); red = up-regulated DEGs (FDR < 0.05, log2FC ≥ +1); blue = down-regulated DEGs (FDR < 0.05, log2FC ≤ −1).g, Volcano plot of DEGs in MCF7 cells transfected with sgRNAMYC-19 treated with Cl-PDS2 vs mock, after sgRNA NTC filtering; Red = up-regulated DEGs (FDR < 0.05, log2FC ≥ +1); blue = down-regulated DEGs (FDR < 0.05, log2FC ≤ −1). Plot includes only genes passing FDR < 0.05 and |log2FC| ≥ 1. The data presented are the mean of n = number of independent biological samples. Statistical significance was calculated using a Welch-corrected two-tailed t-test in GraphPad Prism; p-value: ns > 0.05, * ≤0.05, ** ≤0.01, *** ≤0.001, **** ≤0.0001.
Figure 4:
Figure 4:. ATENA and c-MYC iM targeting.
a, Chemical structure of chloroalkane-modified pep-RVS with a 2-PEG linker (Cl-pep-RVS2). b, RT-qPCR of the indicated genes in MCF7 cells stably expressing dCas9-Halo transfected with sgRNAMYC-19 or sgRNA NTC and incubated for 48h in the presence of 10 μM of Cl-pep-RVS2 or DMSO (mock). The expression values are represented as fold change (2-ΔΔCt) with respect to the mock (DMSO-treated) transfected samples and after normalization for the housekeeping gene (GAPDH). n=2, biological replicates, each with three technical replicates. The data presented are the mean of n = number of independent biological samples. Statistical significance was calculated using a Welch-corrected two-tailed t-test in GraphPad Prism; p-value: ns > 0.05, * ≤0.05, ** ≤0.01, *** ≤0.001, **** ≤0.0001.
Figure 5:
Figure 5:. ATENA unveils a ligand-dependent transcriptional response of the lncPVT1.
a, Schematic overview of the PVT1 promoter containing annotation of the predicted G4, sgRNA targeting region (black triangles) and their relative distance in bp from the G4 forming sequence b, RT-qPCR for PVT1 expression in MCF7 cells stably expressing dCas9-Halo, transfected with either sgRNAPVT1–20, sgRNAPVT1+33 or sgRNA NTC and treated with (2.5 μM) Cl-PDS2 for 48h after transfection. The expression values are represented as fold change (2-ΔΔCt) with respect to the mock (DMSO-treated) and normalized for the housekeeping gene GAPDH; n=3, biological replicates, each of which included two technical replicates. c, BG4 CUT&Tag-qPCR for MCF7 cells stably expressing dCas9-Halo transfected with either sgRNAPVT1–20 or sgRNA NTC and treated with DMSO (mock) or (2.5 μM) Cl-PDS2. BG4 accessibility was analyzed for PVT1 and normalized to three G4s in control gene sites (RPA3, MAZ, RBBP4). n=2, biological replicates, including three technical replicates for BG4 and one for the negative (no BG4 treatment). d, RT-qPCR for PVT1 expression in MCF7 cells stably expressing dCas9-Halo, transfected with either sgRNAPVT1–20, sgRNAPVT1+33 or sgRNA NTC and treated with (2.5 μM) Cl-PhenDC32 for 48h after transfection. Values are represented as fold change (2-ΔΔCt) with respect to the mock (DMSO-treated) and normalized for the housekeeping gene GAPDH. n=3, biological replicates, each of which includes two technical replicates. e, (Top) Chemical structure of chloroalkane-modified PDC (Cl-PDC2) with the PEG linker length of two. e, (bottom) RT-qPCR for PVT1 expression in MCF7 cells stably expressing dCas9-Halo, transfected with either sgRNAPVT1–20 or sgRNA NTC and treated with (2.5 μM) Cl-PDC2 for 48h after transfection. Values are represented as fold change (2-ΔΔCt) with respect to the mock (DMSO-treated) and normalized for the housekeeping gene GAPDH. n=3, biological replicates, each of which includes two technical replicates. Statistical significance was calculated using a Welch-corrected two-tailed t-test in GraphPad Prism; p-value: ns > 0.05, * ≤0.05, ** ≤0.01, *** ≤0.001, **** ≤0.0001.
Figure 6:
Figure 6:. Targeting of de novo G4s with ATENA uncovers a transcriptionally dependent functional response.
A schematic overview of the HMGN1 promoter contains annotation of the predicted G4, two sgRNA designed to target HMGN1-G4 (black triangles), and their relative distance in bp from the G4-forming sequence. b, RT-qPCR for HMGN1 expression in MCF7 cells stably expressing dCas9-Halo, transfected with either sgRNAHMGN1–22, sgRNAHMGN1+34 or sgRNA NTC and treated with (2.5 μM) Cl-PDS2 for 48h after transfection. The expression values are represented as fold change (2-ΔΔCt) with respect to the mock (DMSO-treated) and normalized for the housekeeping gene GAPDH; n=2, biological replicates, each of which includes two technical replicates. c, RT-qPCR for IL17RA expression in MCF7 cells stably expressing dCas9-Halo, transfected with either sgRNAIL17RA-20 or sgRNA NTC and treated with (2.5 μM) Cl-PDS2 for 48h after transfection. The expression values are represented as fold change (2-ΔΔCt) with respect to the mock (DMSO-treated) and normalized for the housekeeping gene GAPDH; n=2, biological replicates, each of which includes two technical replicates. Data presented are the mean of n = number of independent biological samples. Statistical significance was calculated using a Welch-corrected two-tailed t-test in GraphPad Prism; p-value: ns > 0.05, * ≤0.05, ** ≤0.01, *** ≤0.001, **** ≤0.0001.

References

    1. Davis J. T. G-quartets 40 years later: from 5’-GMP to molecular biology and supramolecular chemistry. Angew. Chem. Int. Ed. Engl. 43, 668–698 (2004). - PubMed
    1. Gellert M., Lipsett M. N. & Davies D. R. Helix formation by guanylic acid. Proc. Natl. Acad. Sci. U. S. A. 48, 2013–2018 (1962). - PMC - PubMed
    1. Parkinson G. N., Lee M. P. & Neidle S. Crystal structure of parallel quadruplexes from human telomeric DNA. Nature 417, 876–880 (2002). - PubMed
    1. Biffi G., Tannahill D., McCafferty J. & Balasubramanian S. Quantitative visualization of DNA G-quadruplex structures in human cells. Nat. Chem. 5, 182–186 (2013). - PMC - PubMed
    1. Di Antonio M. et al. Single-molecule visualization of DNA G-quadruplex formation in live cells. Nat. Chem. 12, 832–837 (2020). - PMC - PubMed

Publication types

LinkOut - more resources