

Machine learning algorithms to predict feeding practices during diarrheal disease and its determinants among under-five children in East Africa
- PMID: 40777656
- PMCID: PMC12329795
- DOI: 10.3389/fpubh.2025.1513922
Machine learning algorithms to predict feeding practices during diarrheal disease and its determinants among under-five children in East Africa
Abstract
Background: Diarrhea is the leading cause of childhood malnutrition. Although replacement, continued feeding, and increasing appropriate fluid at home during diarrhea episodes are the cornerstones of treatment packages, food and fluid restrictions are common during diarrheal illnesses in Africa. To fill the methodological and current evidence gaps, this study aimed to build models and predict determinants to increase feeding practices of children in East Africa during diarrheal outbreaks.
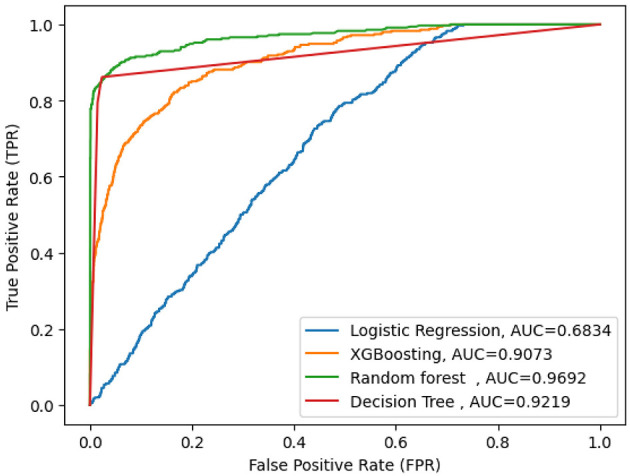
Methods: We used the most recent demographic and health survey (DHS) statistics from 12 East African nations collected between 2012 and 2023. The analyses included a total weighted sample of 20,059 children aged 5 years. Python software was utilized for data processing and machine learning model building. We employed four ML algorithms, such as Random Forest (RF), Decision Tree (DT), XGB (Extreme Gradient Boosting), and Logistic Regression (LR). In this work, we evaluated the predictive models' performance using performance assessment criteria such as accuracy, precision, recall, and the AUC curve.
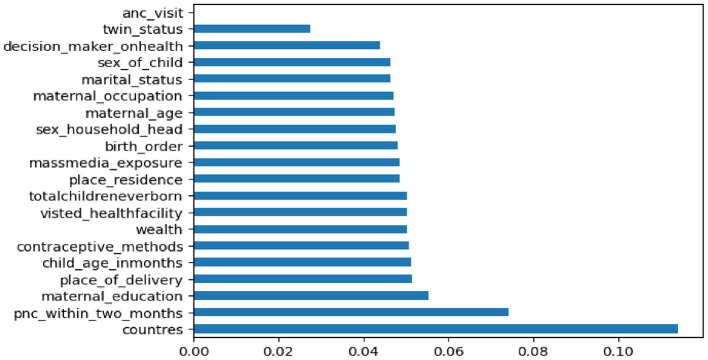
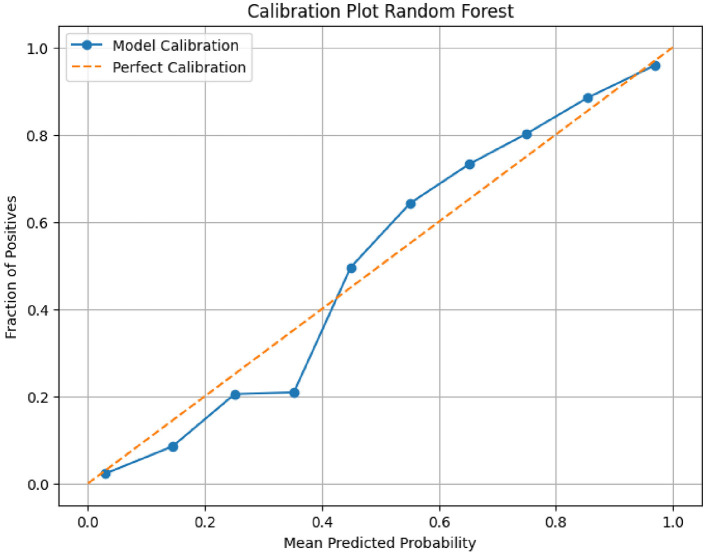
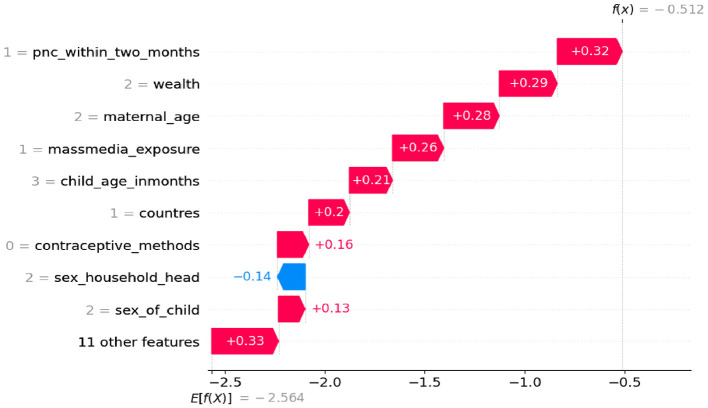
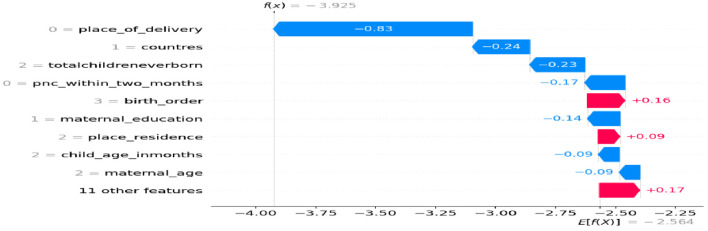
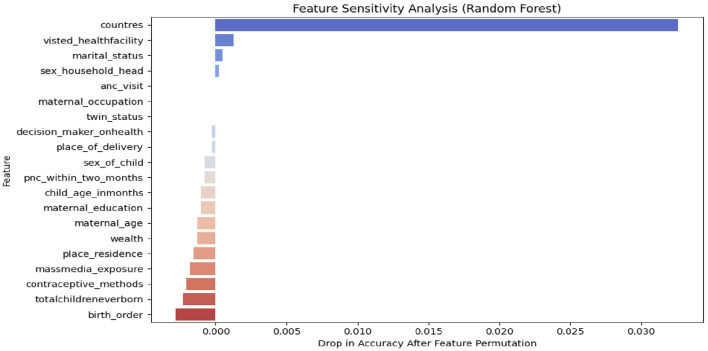
Results: In this study, 20,059 children aged 5 years were used in the final analysis. Among the proposed machine learning models, random forest performed best overall in the proposed classifier, with an accuracy of 97.86%, precision of 98%, recall of 77%, F-measure of 86%, and AUC curve of 97%. The most significant determinants of increasing feeding practice were richest household, faculty delivery, use of modern contraception method, the number of children 3-5, women's employment status, maternal age is 25-34, having media exposure, and health-seeking decisions made by mothers were associated positively, whereas not using contraception, home delivery, the total number of children is large, and the sex of the household was male, which was associated negatively with feeding practice during diarrhea in East Africa.
Conclusion: Machine learning (ML) algorithms have provided valuable insights into the complex factors influencing feeding practices during diarrheal disease in under-five children in East Africa. During diarrhea, only 11 of the 100 children received acceptable child feeding practices. More than one-third of the patients received less than usual or nothing. Reducing diarrhea-related child mortality by improving diarrhea management practices is recommended, particularly focusing on the identified aspects.
Keywords: East Africa; determinants; diarrhea; feeding practice; machine learning model; prediction.
Copyright © 2025 Yehuala, Baykemagn and Terefe.
Conflict of interest statement
The authors declare that the research was conducted in the absence of any commercial or financial relationships that could be construed as a potential conflict of interest.
Figures
Similar articles
-
Comparison of Two Modern Survival Prediction Tools, SORG-MLA and METSSS, in Patients With Symptomatic Long-bone Metastases Who Underwent Local Treatment With Surgery Followed by Radiotherapy and With Radiotherapy Alone.Clin Orthop Relat Res. 2024 Dec 1;482(12):2193-2208. doi: 10.1097/CORR.0000000000003185. Epub 2024 Jul 23. Clin Orthop Relat Res. 2024. PMID: 39051924
-
Application of machine learning algorithms to model predictors of informed contraceptive choice among reproductive age women in six high fertility rate sub Sahara Africa countries.BMC Public Health. 2025 May 29;25(1):1986. doi: 10.1186/s12889-025-23242-w. BMC Public Health. 2025. PMID: 40442626 Free PMC article.
-
Are Current Survival Prediction Tools Useful When Treating Subsequent Skeletal-related Events From Bone Metastases?Clin Orthop Relat Res. 2024 Sep 1;482(9):1710-1721. doi: 10.1097/CORR.0000000000003030. Epub 2024 Mar 22. Clin Orthop Relat Res. 2024. PMID: 38517402
-
Specially formulated foods for treating children with moderate acute malnutrition in low- and middle-income countries.Cochrane Database Syst Rev. 2013 Jun 21;(6):CD009584. doi: 10.1002/14651858.CD009584.pub2. Cochrane Database Syst Rev. 2013. PMID: 23794237
-
Integrated management of childhood illness (IMCI) strategy for children under five.Cochrane Database Syst Rev. 2016 Jun 22;2016(6):CD010123. doi: 10.1002/14651858.CD010123.pub2. Cochrane Database Syst Rev. 2016. PMID: 27378094 Free PMC article.
References
-
- Olopha OO, Egbewale B. Awareness and knowledge of diarrhoeal home management among mothers of under-five in Ibadan, Nigeria. Univ J Public Health. (2017) 5:40–5. 10.13189/ujph.2017.050106 - DOI
-
- World Health Organization . Diarrhoeal Disease: Fact Sheets. (2017). Available online at: https://www.who.int/news-room/fact-sheets/detail/diarrhoeal-disease#:~:t... (Accessed October 11, 2024).
-
- Rahman AMR, Islam MR, Bashar SJ, Al Fidah MF, Amin R, Rahman MM, et al. Trends in preventive practices against diarrhoeal disease among under-five children: experience from the largest diarrhoeal disease hospital in Bangladesh. BMJ Paediatrics Open. (2025) 9:e003259. 10.1136/bmjpo-2024-003259 - DOI - PMC - PubMed
-
- Okoro C, Ikediuwa U, Mgbudem F, Uwabunkonye B, Osondu B. Estimation of levels and trends of under-five mortality in sub-saharan africa: evidence from summary of birth histories of currently married women. Asian J Prob Stat. (2020) 7:17–27. 10.9734/ajpas/2020/v7i230176 - DOI
-
- You D, Hug L, Ejdemyr S, Idele P, Hogan D, Mathers C, et al. Global, regional, and national levels and trends in under-5 mortality between 1990 and 2015, with scenario-based projections to 2030: a systematic analysis by the UN Inter-agency Group for Child Mortality Estimation. Lancet. (2015) 386:2275–86. 10.1016/S0140-6736(15)00120-8 - DOI - PubMed
MeSH terms
LinkOut - more resources
Full Text Sources
Medical