. 2025 Apr 19;5(4):1570-1580.
doi: 10.1016/j.fmre.2025.04.008. eCollection 2025 Jul.

Obox1 deficiency impairs fertility in female mice

Affiliations

Obox1 deficiency impairs fertility in female mice

Li Wu et al. Fundam Res. .

Abstract

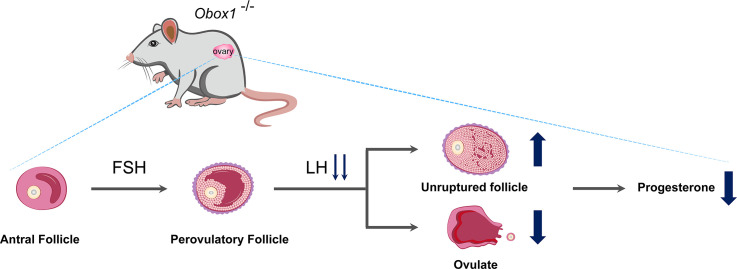
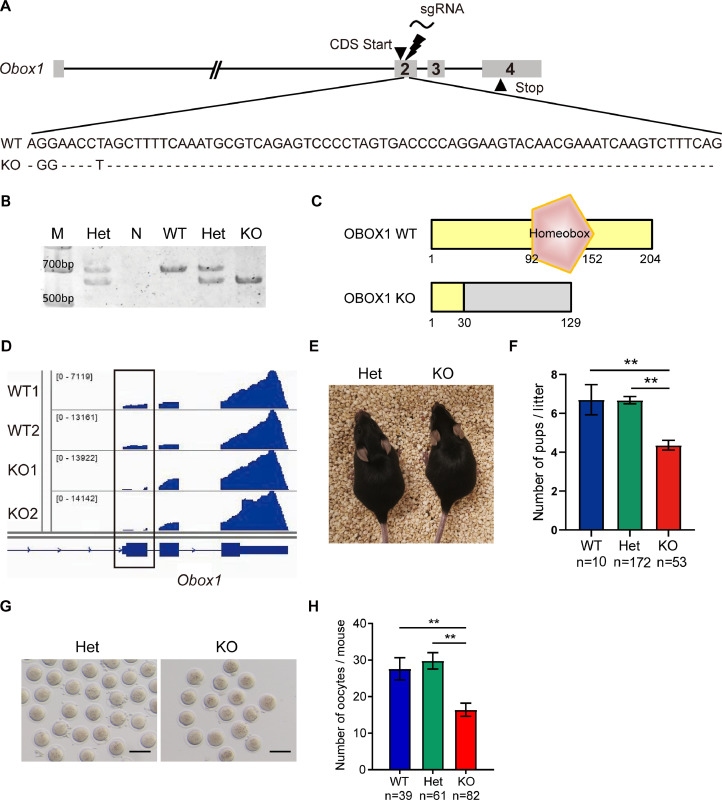
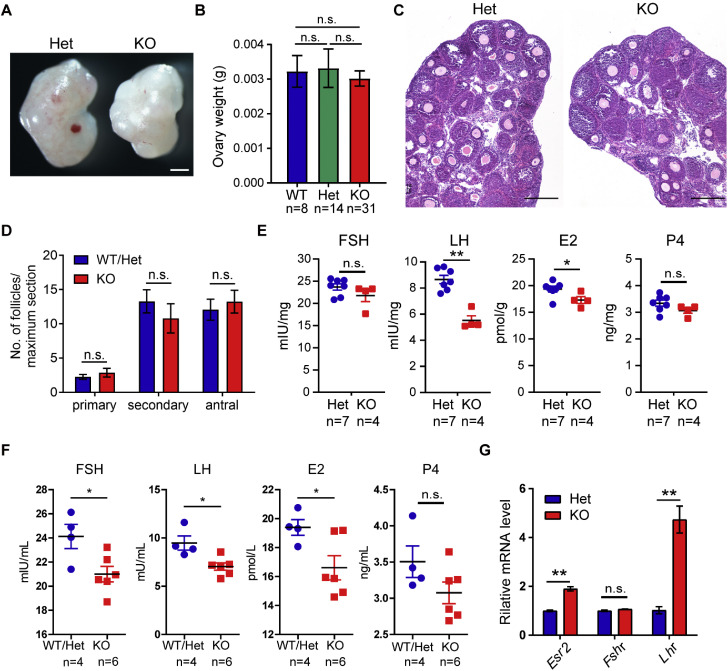
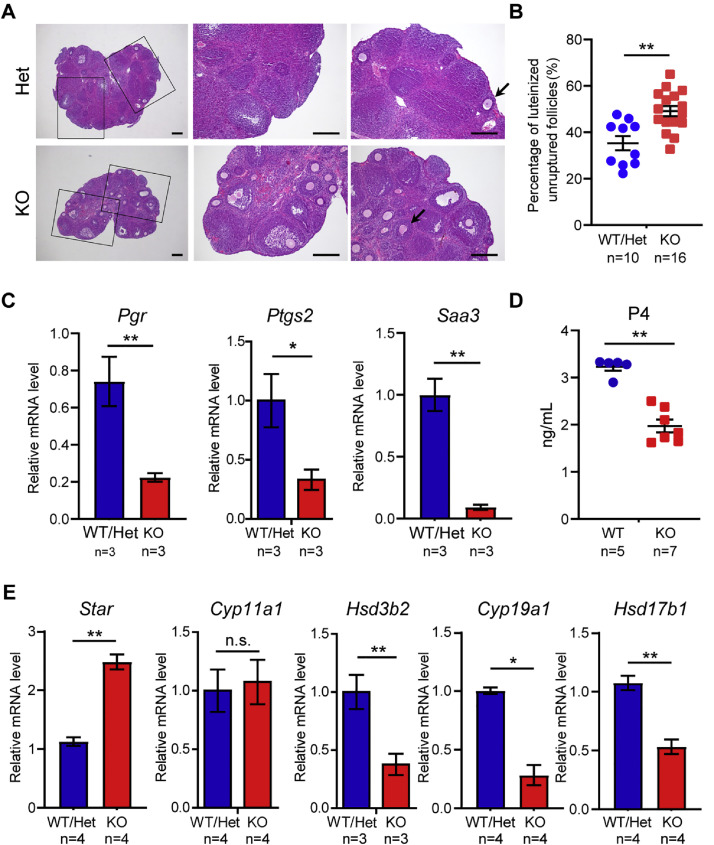
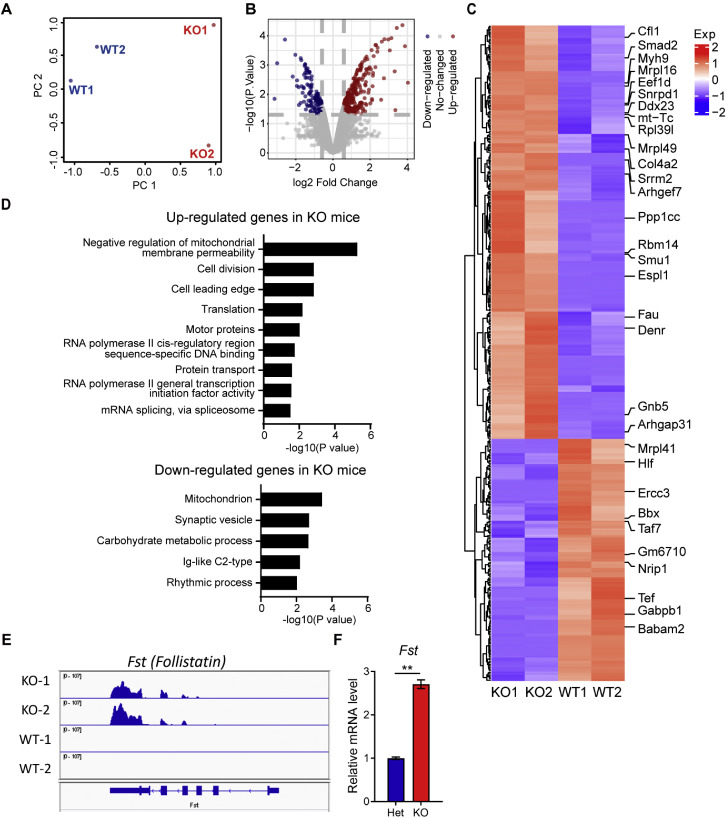
OBOX1 is a maternal factor involved in oogenesis and follicle development, yet its specific role remains unclear. Here, we demonstrated that Obox1 knockout female mice exhibit subfertility, characterized by reduced litter size and impaired ovulation. These oocytes show minimal disruption in early embryonic development post-fertilization. However, Obox1 deficiency leads to decreased levels of gonadotropins and female sex hormones, especially the luteinizing hormone (LH). Exogenous human chorionic gonadotropin (hCG) administration during superovulation failed to rescue the ovulation defect. Post-ovulation, the ovulation-related genes and serum progesterone levels were significantly reduced in Obox1-deficienct ovaries, accompanied by dysregulated steroidogenesis-related gene expression. Transcriptomic profiling of Obox1 deficient metaphase II (MII) oocytes revealed downregulation of genes involved in mitochondrial energy metabolism and biosynthesis, and upregulation of genes associated with cell transport, transcription, RNA processing, translation. Further investigation revealed that follistatin gene expression was upregulated in both MII oocytes and ovaries of Obox1 deficient mice, along with increased expression of Gdf9, Bmp15, Foxl2, and NOTCH signaling components. These findings suggest that Obox1 is essential for maintaining hormonal balance and ovulatory function through regulating oocyte-granulosa cell interactions and steroid hormone synthesis.

Keywords: Aberrant steroidogenesis; Abnormal luteinization; Hormone deficiency; Oocyte-granulosa cell interactions; Subfertility.


Conflict of interest statement

The authors declare that they have no conflicts of interest in this work.

Figures

Image, graphical abstract
Graphical abstract
Fig 1
Fig. 1
Deletion of Obox1 Leads to Subfertility in Female Mice. See also Fig. S1 and S2. A. CRISPR-Cas9 targeting strategy used to generate Obox1 knockout mice. A 73-bp deletion combined with a 3-bp insertion in exon 2 results in a net 70-bp indel, disrupting the coding sequence. B. Genotyping results showing wild-type (WT), heterozygous (Het) and homozygous knockout (KO) alleles. M, DNA marker; N, negative control. C. Schematic comparison of OBOX1 protein sequences between WT and KO mice. The homeobox domain is indicated in brown; shared sequences are highlighted in yellow. D. IGV browser view of Obox1 RNA-seq reads in MII oocytes. In WT oocytes continuous read coverage is observed across exon 2. In KO oocytes, reads mapping to the targeted region within exon 2 are absent, confirming successful transcript disruption. E. Representative images of adult female Obox1 Het and Obox1 KO mice. F. Litter sizes produced by WT, Obox1 Het, and Obox1 KO females. Data are presented as means ± SEM. ⁎⁎p < 0.01 by Student’s t-test. G. Morphology of MII oocytes collected from adult Obox1 Het and KO mice after superovulation. Scale bars, 100 µm. H. Quantification of MII oocytes collected from adult WT, Obox1 Het and KO females after superovulation. Data are presented as means ± SEM. ⁎⁎p < 0.01 by Student’s t-test.
Fig 2
Fig. 2
Obox1 Deficiency Does Not Affect Early Embryonic Development. See also Fig. S3. A. Representative images showing embryonic development after ICSI using MII oocytes from WT or Obox1 KO mice and sperm from Obox1 KO mice. Embryos were monitored at various stages. Scale bars, 200 µm. B. Quantification of embryos at different developmental stages after ICSI using MII oocytes from WT or Obox1 KO mice and sperm from Obox1 KO mice. Data are presented as percentages of total embryos observed at each stage. C. Morphology of embryonic stem cells (ESCs) derived from Obox1 Het and KO blastocysts. ESC colonies were cultured on mitomycin C-treated mouse embryonic fibroblasts and observed under phase-contrast microscopy. Scale bars, 100 µm. D. Growth curve of ESCs derived from Obox1 Het and Obox1 KO blastocysts. Cell proliferation was assessed by manual cell counting over a defined culture period. Data are presented as mean ± SEM.
Fig 3
Fig. 3
Obox1 KO Mice Display Abnormal Hormone Levels at Diestrus. A. Representative photographs of ovaries from WT and Obox1 KO females. Scale bars, 500 µm. B. Ovarian weight of adult WT (n = 8), Obox1 Het (n = 14), and Obox1 KO (n = 31) females. Data are presented as mean ± SEM. n.s., not significant (p > 0.05) by Student’s t-test. C. Hematoxylin and eosin (H&E) staining of ovaries from 3-week old WT/Het and Obox1 KO females at diestrus. Scale bar, 200 μm. D. Quantification of follicles at various developmental stage based on H&E staining of ovarian sections from adult WT/Het and Obox1 KO females. Statistical analysis was performed on the number of follicles per maximum section (WT/Het: n = 9; KO: n = 8). Data are presented as the mean ± SEM. n.s., not significant (p > 0.05) by Student’s t-test. E. Enzyme-linked immunosorbent assay (ELISA) measurements of ovarian follicle-stimulating hormone (FSH), luteinizing hormone (LH), estrogen (E2) and progesterone (P4) in WT, Het, and KO females at diestrus. Data are presented as the mean ± SEM. n.s., not significant (p > 0.05), *p < 0.05, **p < 0.01 by Student’s t-test. F. ELISAs showing the serum levels of FSH, LH, E2 and P4 in WT, Het, and KO females at diestrus. Data are presented as the mean ± SEM. n.s., not significant (p > 0.05), *p < 0.05 by Student’s t-test. G. Quantitative reverse transcription PCR (qRT-PCR) analysis of mRNA expression levels of estrogen receptor beta (Esr2), FSH receptor (Fshr) and LH receptor (Lhr) in ovaries from Obox1 Het and KO females. Data has normalized to 18S rRNA and are presented as the means ± SEM. n.s., not significant (p > 0.05), ⁎⁎p < 0.01 by Student’s t-test.
Fig 4
Fig. 4
Defective Ovulation and Steroidogenesis in Obox1 KO Ovaries after Superovulation. See also Fig. S4. A. Representative H&E-stained ovaries from 3- to 4-week-old Obox1 WT/Het and KO mice at 14-16 h post-hCG injection following superovulation. Arrows indicate unruptured follicles. Scale bar, 200 μm. B. Quantification of the percentage of the unruptured follicles after hCG treatment in Obox1 Het and KO female mice. Data are presented as mean ± SEM. ⁎⁎p < 0.05 by Student’s t-test. C. qRT-PCR analysis of ovulation-induced genes expression, including Pgr, Ptgs2, and luteal-related gene Saa3, in Obox1 WT/Het and KO ovaries at 48 h after hCG treatment. Gene expression was normalized to Rpl19. Data are presented as the means ± SEM. *p < 0.05, ⁎⁎p < 0.01 by Student’s t-test. D. ELISA showing serum P4 level in Obox1 WT and KO females 48 h after hCG treatment. Data are shown as the means ± SEM. ⁎⁎p < 0.01 by Student’s t-test. E. qRT-PCR analysis of steroidogenic gene expression in Obox1 WT/Het and KO ovaries 48 hours after hCG treatment. Expression was normalized to Rpl19. Data are presented as means ± SEM. n.s., not significant (p > 0.05), *p < 0.05, **p < 0.01 by Student's t-test.
Fig 5
Fig. 5
Transcriptomic Abnormalities in MII oocytes from Obox1 KO Mice. See also Fig. S5 and Table S2. A. Principal component analysis (PCA) of RNA-seq data showing the global transcriptomic differences between WT and Obox1 KO MII oocytes. B. Volcanic plot displaying differentially expressed genes (DEGs) in MII oocytes from Obox1 KO mice compared with WT controls. C. Heatmap showing expression profiles of DEGs in MII oocytes (FPKM > 1, fold change > 1.5, p value < 0.05). D. Gene Ontology (GO) enrichment analysis of genes dysregulated in Obox1 KO MII oocytes. E. IGV browser view of RNA-seq reads showing expression of Fst in MII oocytes from WT and Obox1 KO mice. F. qRT-PCR analysis of Fst mRNA levels in ovaries from Obox1 Het and KO females (n = 3). Data are normalized to 18S rRNA and presented as the means ± SEM. ⁎⁎p < 0.01 by Student’s t-test.

Similar articles

References

    1. Magalhaes R.S., Atala A. In: Principles of Regenerative Medicine. 3rd Edition. Atala A., Lanza R., Mikos A.G., et al., editors. Academic Press; Location: 2019. Chapter 70 - Regenerative Medicine for the Female Reproductive System of chapter; pp. 1237–1250.
    1. Richards J.S., Pangas S.A. The ovary: Basic biology and clinical implications. J. Clin. Invest. 2010;120:963–972. - PMC - PubMed
    1. Das P.K., Mukherjee J., Banerjee D., et al. In: Textbook of Veterinary Physiology. Das P.K., Sejian V., Mukherjee J., et al., editors. Springer Nature Singapore; Location: 2023. Female Reproductive Physiology of chapter; pp. 513–568.
    1. Messinis I.E., Messini C.I., Dafopoulos K. The role of gonadotropins in the follicular phase. Ann NY Acad. Sci. 2010;1205:5–11. - PubMed
    1. Gingold J.A., Jain M., Jalai C. In: Clinical Reproductive Medicine and Surgery: A Practical Guide. Falcone T., Hurd W.W., editors. Springer Nature Switzerland AG; Cham, Switzerland: 2022. Hypothalamic-Pituitary-Ovarian Axis and Control of the Menstrual Cycle of chapter; pp. 1–22.

LinkOut - more resources