. 2023 May:69:102006.
doi: 10.1016/j.jocs.2023.102006. Epub 2023 Apr 5.

Assessing the identifiability of model selection frameworks for the prediction of patient outcomes in the clinical breast cancer setting

Affiliations

Assessing the identifiability of model selection frameworks for the prediction of patient outcomes in the clinical breast cancer setting

C M Phillips et al. J Comput Sci. 2023 May.

Abstract

We develop a family of mathematical models to predict patient-specific response to neoadjuvant therapy in breast cancer. The models capture key features of tumor growth, therapeutic response, and tissue mechanics that are informed by diffusion weighted and dynamic contrast-enhanced magnetic resonance imaging. We then calibrate the models to synthetic and clinical data using Bayesian inference to give a description of the parameter uncertainties. Given the family of models and the calibration scheme, we perform three analyses. First, we test the identifiability of each model; that is, given synthetic data with the same level of noise as that seen in the clinical setting, are we able to accurately recover parameter values employed to generate the data? Second, we test the identifiability of the framework itself; that is, when data is generated by one model from the family, is that model selected as the best one during the calibration? Third, we apply our model family to predict patient-specific response on a cohort of 32 patients with triple negative breast cancer. For analysis 1, we show that we can recover the parameters used to generate synthetic data (with 5%, 10%, and 15% Gaussian noise - greater than that typically seen in magnetic resonance imaging in the clinical setting) with a mean error of 5.9% (+/-1.4%). For analysis 2, the model used to generate the data is selected as the best model for over 50% of the synthetic data sets, provided that the noise level in the synthetic data is less than 10%. For analysis 3, we show that the calibrated drug efficacy rate in the diffusion and proliferation mechanically coupled, drug informed, reaction diffusion model strongly correlates with patient response to therapy with an area under the curve score of 0.85 in a receiver operator characteristic analysis. Thus, our framework shows that, within the noise levels encountered in the clinical setting, a high level of rigor can be achieved for mathematical model parameterizations and selections, and this translates into high accuracy for predicting responders and non-responders to neoadjuvant therapy.

Keywords: Bayesian inference; Computational Oncology; Image-based modelling; Model selection.


Figures

Figure 1:
Figure 1:
Schematic of the three analyses. Panel (A) shows the workflow of analyzing each individual model and its identifiability. We generate noised synthetic data from the initial time point of a patient’s quantitative MRI data using model m and calibrate model m to the synthetic data. We assess the goodness of fit and the calibrated parameter distributions versus the true parameters used to generate the data to determine if each model is identifiable. Panel (B) depicts the workflow to determine the identifiability of the model framework to select the best model (i.e., the model used to generate the synthetic data). We calibrate each data set to each model, compute the model selection criteria, and calculate the ability of the framework to recover the true model used under 5%, 10%, and 15% noise. Panel (C) describes the model selection framework using longitudinal patient data, where each patient data set is calibrated with each model to determine the ability of each model to predict the response of TNBC to NAT.
Figure 2:
Figure 2:
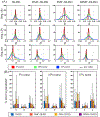
Summary of model identifiability analysis. Panel (A) shows example in silico calibrations with one specific parameter set for each model across three noise thresholds. Each row denotes the parameter being calibrated (k, proliferation rate; D, diffusion coefficient; α, drug efficacy rate; with the true parameter value depicted with a vertical black line) with 5% (red), 10% (green), and 15% (blue) noise levels added to the data. Each column depicts a different model used to calibrate to the data. The vertical axes define the frequency that the parameter value occurs in the last level of sampling (across 2000 samples). We note that the true parameter value is the same across all models for this specific sample. Panel (B) shows the mean and standard deviation of each calibrated parameter, across different models and noise levels. The relative parameter error averaged across noise levels and models are 8.6%, 2.2%, and 6.8% for k,D, and α, respectively. The average for each parameter for each model is less than 10% across all noise levels (except k in the PMC-DI-RD model).
Figure 3:
Figure 3:
Framework for determining the identifiability of model selection. The patient images, both DW- and DCE-MRI, are used to initialize the tumor volume fraction (shown in Panels (A) and (B)) and drug concentration for simulations. Data is generated from one of the four models (DMC-DI-RD here), shown in Panel (C), given a specific set of parameters and then noise is added to the image (here we show 10% Gaussian noise; Panel (D)). All four models are fit; an example fit (with parameters taken from the posterior distribution after calibration) of each model is shown in Panel (E) and the absolute error is shown in Panel (F). We then select the model with the lowest Bayesian Information criterion (Panel (G)); in this case, it is the DMC-DI-RD model which was the one actually used to generate the original data set.
Figure 4:
Figure 4:
Analysis of the model selection framework identifiability. Panel (A) depicts an example of voxel-wise comparison between synthetically generated data (in this case, from the DMC-DI-RD model) and each model during calibration. The vertical axes show the model calculated voxel-wise tumor volume fraction, and the horizontal axis shows the corresponding value for those voxels in the synthetic data. The black line denotes the line of unity, where all the voxels in a perfectly fit model would lie perfectly on the line.
Figure 5:
Figure 5:
Predicting total tumor cellularity in the model selection framework. We show the predicted tumor mass at timepoint three for each calibration at 10% noise for 20 simulated datasets. Panel (A) depicts the prediction of DI-RD generated data calibrated to each model. Panels (B), (C), and (D) show the prediction of DMC-DI-RD, PMC-DI-RD, and DPMC-DI-RD generated data calibrated to each model. When calibrated to data generated with the DI-RD data model (Panel (A)) or the DMC-DI-RD model (Panel (B)), the DI-RD and the DMC-DI-RD model both correlate (CCC > 0.5) with tumor volume fraction, but the PMC-DI-RD and DPMC-DI-RD have CCC values less than 0.2. However, when the models with proliferation feedback generate the data, the simpler models (DI-RD and DMC-DI-RD) have CCC values ranging from 0.37 – 0.59. Specifically, the DI-RD and DMC-DI-RD models, without proliferation feedback, more accurately predict (i.e., more strongly correlate) tumor volume fraction generated by other models (i.e., models not used to generate the data). Across all synthetic data, predictions made by models without proliferation over predict the synthetic data and predictions made by models with proliferation under predict the synthetic data.
Figure 6:
Figure 6:
An example of the model selection framework in the clinical setting. The panels illustrate an example model selection output. We initialize the models with patient-specific quantitative MRI with the full image shown in Panel (A) and the reduced image in Panel (B). First, each model is fit to the calibration data (Panel (C)), with an example fit (with parameters taken from the posterior distribution after calibration) of each model is shown in Panel (D). The best calibration model is selected (the DI-RD model in this case, Panel (E)) and all models are reinitialized (using the calibration data shown in Panel (C)). From the calibration time data, the patient response is predicting using samples from the parameter distributions that were calibrated in Panel (D). The best model for prediction, depicted in Panel (F), over the whole cohort is the DPMC-DI-RD model, shown in the bottom row. The Dice scores for calibration are 0.92, 0.90, 0.90, and 0.91, and the Dice scores for prediction are 0.85, 0.83, 0.85, and 0.85, for the DI-RD, DMC-DI-RD, PMC-DI-RD, DPMC-DI-RD, respectively.
Figure 7:
Figure 7:
Summary of the best model selection in the patient data. Panels (A) and (B) show the correlation between model calibrated and predicted tumor cellularity with the best model (DPMC-DI-RD) and the measured tumor cellularity. The PCC and CCC values show a strong correlation between the predicted patient cellularity and the observed data (Panel (B)). In Panel (C), we highlight the ROC analysis of the change in total tumor volume fraction between the initial and calibration time point measured directly from the DW-MRI data (“MRI cellularity” in the legend, blue line), the change in total tumor volume fraction predicted by the DPMC-DI-RD model from the calibrated data (“Prediction 2 to 3”, red), the change in total tumor volume fraction predicted by the DPMC-DI-RD model from the initial data (“Prediction 1 to 3”, purple), and the calibrated drug efficacy rate (“Drug efficacy rate”, orange) to assess patient complete pathological response.

Similar articles

Cited by

References

    1. Media MA, Oza G, Sharma A, Arriaga LG, Hernández JM, Rotello VM, Ramirez JT, Triple-negative breast cancer: A review of conventional and advanced therapeutic strategies, International Journal of Environmental Research and Public Health 17 (6). doi: 10.3390/ijerph17062078. - DOI - PMC - PubMed
    1. Bianchini G, Balko JM, Mayer IA, Sanders ME, Gianni L, Triple-negative breast cancer: challenges and opportunities of a heterogeneous disease, Nature Reviews Clinical Oncology 13 (2016) 674–690. doi: 10.1038/nrclinonc.2016.66. - DOI - PMC - PubMed
    1. Schmid P, Cortes J, Pusztai L, McArthur H, Kümmel S, Bergh J. t., Pembrolizumab for early triple-negative breast cancer, N Engl J Med. 382 (9) (2020) 810–821. doi: 10.1056/NEJMoa1910549. - DOI - PubMed
    1. Yankeelov TE, Peterson TE, Abramson RG, Garcia-Izquierdo D, Arlinghaus LR, Li X, Atuegwu NC, Catana C, Manning HC, Fayad ZA, Gore JC, Simultaneous pet-mri in oncology: a solution looking for a problem?, Magnetic Resonance Imaging 30 (9) (2012) 1342–1356. doi: 10.1016/j.mri.2012.06.001. - DOI - PMC - PubMed
    1. Weis JA, Miga MI, Arlinghaus LR, Li X, Abramson V, Chakravarthy AB, Pendyala P, Yankeelov TE, Predicting the response of breast cancer to neoadjuvant therapy using a mechanically coupled reaction-diffusion model, Cancer Research 75 (2015) 4697–4707. doi: 10.1158/0008-5472.CAN-14-2945. - DOI - PMC - PubMed

LinkOut - more resources