. 2025 Jul 24:16:1634995.
doi: 10.3389/fphar.2025.1634995. eCollection 2025.

BCL6 promotes the progression of high-grade serous ovarian cancer cells by inhibiting PLAAT4

Affiliations

BCL6 promotes the progression of high-grade serous ovarian cancer cells by inhibiting PLAAT4

An Wan et al. Front Pharmacol. .

Abstract

Background: B-cell lymphoma 6 (BCL6) is increasingly recognized as a driver of cancer progression; however, the precise molecular mechanisms by which BCL6 facilitates high-grade serous ovarian cancer (HGSOC) progression remain incompletely understood.

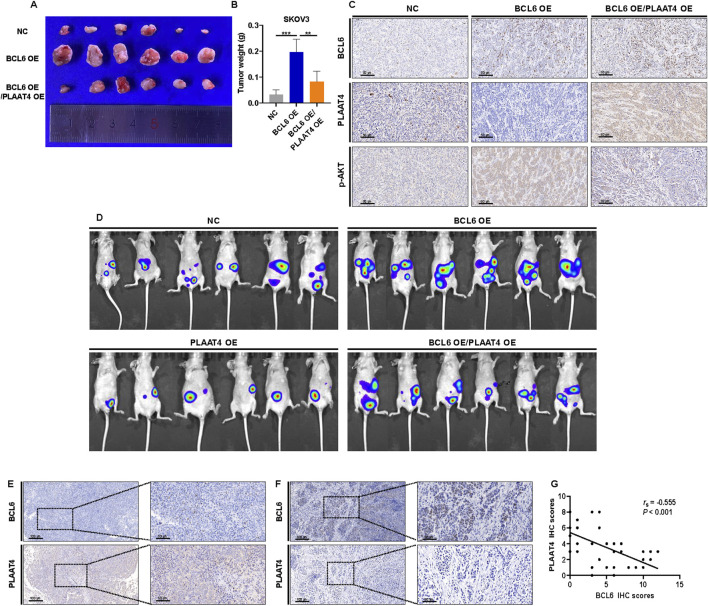
Methods: In this study, immunohistochemical (IHC) staining was used to evaluate the expression of BCL6 and PLAAT4 in HGSOC tissues and normal tissues. Cleavage under targets and tagmentation (CUT&Tag) was combined with RNA sequencing (RNA-seq) analyses to screen and identify the downstream regulatory mechanisms of BCL6. Wound healing assays, plate cloning, EdU, and transwell assays were used to analyze cell proliferation and invasion. The expression of PI3K-AKT, EMT, and proliferation markers were analyzed by immunohistochemistry in vivo or by Western blot in vitro. In vivo, we established a subcutaneous transplantation tumor model and abdominal metastasis model in nude mice to verify the role of BCL6 and PLAAT4 in HGSOC progression.

Results: Clinical analyses revealed that BCL6 expression is significantly elevated in high-grade serous ovarian cancer (HGSOC) tissues compared with that in normal tissues, whereas PLAAT4 expression is reduced. Moreover, high BCL6 and low PLAAT4 expression are associated with poor prognosis in patients with HGSOC. Biological function tests showed that BCL6 contributes to tumor cell proliferation, invasion, and migration, and plays an important role in the progression of HGSOC in vivo. Mechanistically, our investigation revealed that BCL6 promotes HGSOC progression by downregulating PLAAT4, thereby influencing the activation of the phosphoinositide 3-kinase (PI3K)/protein kinase B (AKT) signaling pathway.

Conclusion: Collectively, these findings elucidate the pivotal role of the BCL6-PLAAT4-AKT axis in HGSOC progression, establishing a molecular framework for targeting this pathway as a potential therapeutic strategy against HGSOC.

Keywords: Akt; BCL6; PLAAT4; high-grade serous ovarian cancer; ovarian cancer.


Conflict of interest statement

The authors declare that the research was conducted in the absence of any commercial or financial relationships that could be construed as a potential conflict of interest.

Figures

FIGURE 1
FIGURE 1
BCL6 induces malignant behaviors in HGSOC cells. (A) Representative images of BCL6 protein staining by IHC in normal fallopian tube and HGSOC tissues. (B) Kaplan-Meier analysis of overall survival in 41 patients with HGSOC stratified by BCL6 expression levels. (C,D) Western blotting analysis of the HGSOC cell lines SKOV3 (C) and COV504 (D) after transfection with pCMV-BCL6-Neo plasmid to overexpress BCL6. (E) Assessment of cell proliferation in the cells from (C), measured by EdU assays (scale bar = 1,000 µm). (F) Assessment of cell proliferation in the cells from (D), measured by EdU assays (scale bar = 1,000 µm). (G) Assessment of cell colony formation ability in the cells from (C), measured by colony formation assays. (H) Assessment of cell colony formation ability in the cells from (D), measured by colony formation assays. (I) Assessment of migration in the cells from (C), measured by wound healing assays (scale bar = 200 µm). (J) Assessment of migration in the cells from (D), measured by wound healing assays (scale bar = 200 µm). (K) Assessment of invasion in the cells from (C), measured by transwell assays (scale bar = 200 µm). (L) Assessment of invasiveness of cells from (D), measured by transwell assays (scale bar = 200 µm). (M,N) Western blotting analysis of cyclin D1, vimentin, E-cadherin, and MMP1 in total cell lysates after overexpression of BCL6 in SKOV3 and COV504 cells. The data are presented as the means ± SDs of n = 3 independent biological experiments; two-tailed Student’s t-test, *P < 0.05, **P < 0.01, ***P < 0.001, ns, not significant.
FIGURE 2
FIGURE 2
BCL6 promotes the proliferation, migration, and invasion of HGSOC cells via the PI3K/AKT pathway. (A) Volcano plots of the differentially expressed genes, with 419 upregulated genes and 457 downregulated genes, in SKOV3 cells transfected with pCMV-BCL6 relative to SKOV3 cells transfected with pCMV-NC via RNA-sequencing (RNA-seq) analysis. (B) KEGG analysis of the differentially expressed genes in (A). (C) Heatmap summarizing genes differentially expressed in (A). (D) Gene set enrichment analysis (GSEA) output images of the PI3K-AKT pathway. (E,F) Western blotting analysis of AKT and p-AKT in total cell lysates after overexpression of BCL6 or after knockout of BCL6 in SKOV3 and COV504 cells. (G,H) Relative expression levels of E-cadherin, vimentin, MMP1, cyclin D1, AKT, p-AKT, and BCL6 in the indicated cells treated with or without LY294002. The data are presented as the means ± SDs of n = 3 independent biological experiments; two-tailed Student’s t-test; *P < 0.05, **P < 0.01, ***P < 0.001, ns, not significant.
FIGURE 3
FIGURE 3
BCL6 activates the PI3K‒AKT signaling pathway by negatively regulating PLAAT4. (A) Genomic distribution of CUT&Tag peaks in SKOV3 cells. (B) KEGG analysis of the peak-related genes in (A). (C) Venn diagram of overlapping genes between sets of genes downregulated through RNA-seq and the target gene set identified by CUT&Tag. (D) qRT‒PCR revealed that SKOV3 and COV504 cells overexpressing BCL6 presented decreased PLAAT4 mRNA expression. (E,F) Western blotting revealed that SKOV3 and COV504 cells overexpressing BCL6 presented decreased PLAAT4 protein expression, whereas BCL6 knockout resulted in the opposite trend. (G) BCL6 peak enrichment in the promoter region of the PLAAT4 gene according to CUT&Tag analysis. (H) Sequence logo of a potential BCL6-binding site in CUT&Tag. (I) A diagram of mutant sites in the PLAAT4 sequence. (J) Dual-luciferase reporter assay with the promoter of PLAAT4 and the mutated promoter of PLAAT4 in BCL6-overexpressing SKOV3 cells. (K,L) Immunoblot analysis of AKT, p-AKT, BCL6, and PLAAT4 in BCL6-overexpressing SKOV3 and COV504 cells transfected with or without PLAAT4. The data are presented as the means ± SDs of n = 3 independent biological experiments; two-tailed Student’s t-test; *P < 0.05, **P < 0.01, ***P < 0.001, ns, not significant.
FIGURE 4
FIGURE 4
PLAAT4 suppresses malignant behaviors in HGSOC cells. (A) Representative images of PLAAT4 protein staining by IHC in normal fallopian tube and HGSOC tissues. (B) Kaplan-Meier analysis of overall survival in 41 HGSOC patients stratified by PLAAT4 expression. (C,D) Western blot analysis of AKT and p-AKT in total cell lysates after PLAAT4 was overexpressed in SKOV3 and COV504 cells. (E) Assessment of the colony-forming ability of SKOV3 cells via colony formation assays. (F) Assessment of the colony-forming ability of COV504 via colony formation assays. (G) Assessment of proliferation in SKOV3 cells via EdU incorporation assays (scale bar = 1,000 µm). (H) Assessment of COV504 proliferation via EdU assays (scale bar = 1,000 µm). (I) Assessment of the invasiveness of SKOV3 cells via transwell assays (scale bar = 200 µm). (J) Assessment of the invasiveness of COV504 cells via transwell assays (scale bar = 200 µm). (K) Assessment of migration in SKOV3 cells via wound-healing assays (scale bar = 200 µm). (L) Assessment of COV504 cell migration in wound-healing assays (scale bar = 200 µm). (M,N) Western blot analysis of cyclin D1, vimentin, E-cadherin, and MMP1 in total cell lysates after overexpression of PLAAT4 in SKOV3 and COV504 cells.
FIGURE 5
FIGURE 5
BCL6 induces HGSOC cell malignant behaviors via the tumor suppressor protein PLAAT4. (A,B) Colony formation of BCL6-overexpressing SKOV3 and COV504 cells, with or without PLAAT4 re-expression, was measured via colony formation assays. (C,D) Proliferation of BCL6-overexpressing SKOV3 and COV504 cells, with or without PLAAT4 re-expression, was measured via EdU assays. (E–H) The migration and invasion of BCL6-overexpressing SKOV3 and COV504 cells, with or without PLAAT4 re-expression, were analyzed via transwell and wound healing assays. (I,J) Western blot analysis of BCL6, PLAAT4, cyclin D1, vimentin, E-cadherin, and MMP1 in BCL6-overexpressing SKOV3 and COV504 cells with or without PLAAT4 re-expression. The data are presented as the means ± SDs of n = 3 independent biological experiments; two-tailed Student’s t-test; *P < 0.05, **P < 0.01, ***P < 0.001, ns, not significant.
FIGURE 6
FIGURE 6
BCL6 promotes HGSOC growth and metastasis via PLAAT4 in vivo. (A,B) BCL6-overexpressing SKOV3 cells, with or without PLAAT4 re-expression, were subcutaneously injected into nude mice. Images (A) and weights (B) of the excised xenografts recovered at 21 days. Data represent mean ± SD, n = 6 mice per group. (C) Representative IHC staining of BCL6, PLAAT4 and p-AKT in tumors derived from nude mice. (D) Bioluminescence imaging at 28 days after intraperitoneal injection using IVIS Imaging System. (E,F) HGSOC tissues were analyzed in parallel for the expression of BCL6 and PLAAT4 via immunohistochemical (IHC) staining. Representative staining of cases with low and high expression of BCL6, respectively (E,F) and quantification of IHC staining as immunoreactive scores (IRS) (G). *P < 0.05, **P < 0.01, ***P < 0.001, ns, not significant.
FIGURE 7
FIGURE 7
Schematic diagram showing how BCL6 regulates malignant behaviors in HGSOC through the transcriptional control of PLAAT4.

References

    1. Bast R. C., Jr., Matulonis U. A., Sood A. K., Ahmed A. A., Amobi A. E., Balkwill F. R., et al. (2019). Critical questions in ovarian cancer research and treatment: report of an American Association for Cancer Research Special Conference. Cancer. 125 (12), 1963–1972. 10.1002/cncr.32004 - DOI - PMC - PubMed
    1. Bray F., Laversanne M., Sung H., Ferlay J., Siegel R. L., Soerjomataram I., et al. (2024). Global cancer statistics 2022: GLOBOCAN estimates of incidence and mortality worldwide for 36 cancers in 185 countries. CA Cancer J. Clin. 74 (3), 229–263. 10.3322/caac.21834 - DOI - PubMed
    1. Cardenas M. G., Oswald E., Yu W., Xue F., MacKerell A. D., Jr., Melnick A. M. (2017). The expanding role of the BCL6 oncoprotein as a cancer therapeutic target. Clin. Cancer Res. 23 (4), 885–893. 10.1158/1078-0432.CCR-16-2071 - DOI - PMC - PubMed
    1. De Santis F., Romero-Cordoba S. L., Castagnoli L., Volpari T., Faraci S., Fucà G., et al. (2022). BCL6 and the Notch pathway: a signaling axis leading to a novel druggable biotarget in triple negative breast cancer. Cell Oncol. (Dordr) 45 (2), 257–274. 10.1007/s13402-022-00663-y - DOI - PubMed
    1. DiSepio D., Ghosn C., Eckert R. L., Deucher A., Robinson N., Duvic M., et al. (1998). Identification and characterization of a retinoid-induced class II tumor suppressor/growth regulatory gene. Proc. Natl. Acad. Sci. U. S. A. 95 (25), 14811–14815. 10.1073/pnas.95.25.14811 - DOI - PMC - PubMed

LinkOut - more resources