

PCLDA: An interpretable cell annotation tool for single-cell RNA-sequencing data based on simple statistical methods
- PMID: 40778314
- PMCID: PMC12329077
- DOI: 10.1016/j.csbj.2025.07.019
PCLDA: An interpretable cell annotation tool for single-cell RNA-sequencing data based on simple statistical methods
Abstract
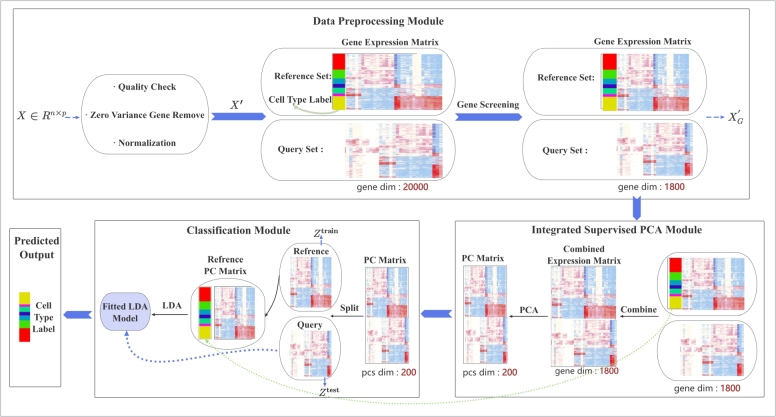
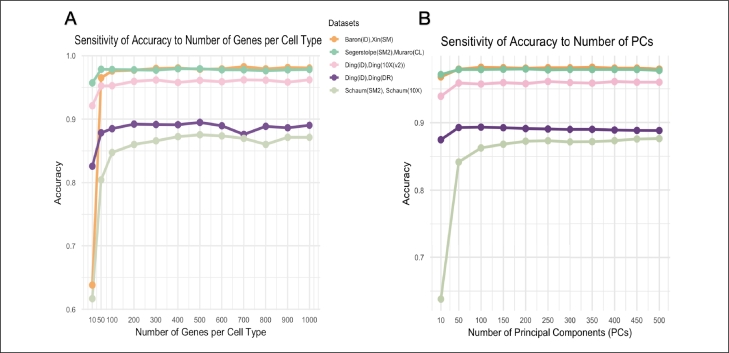
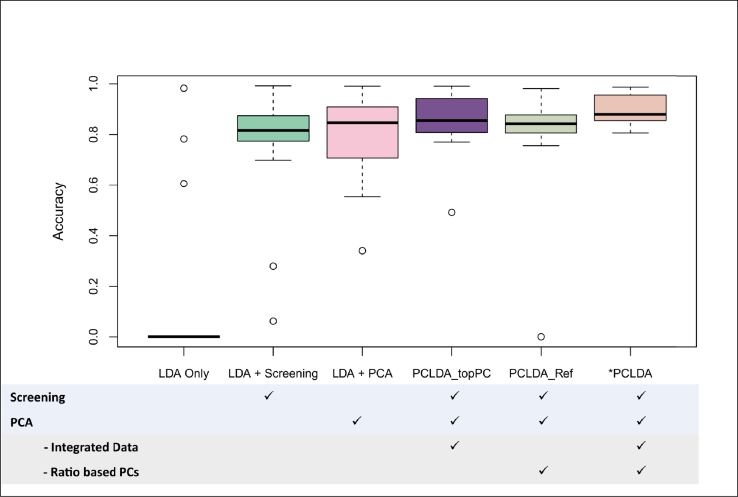
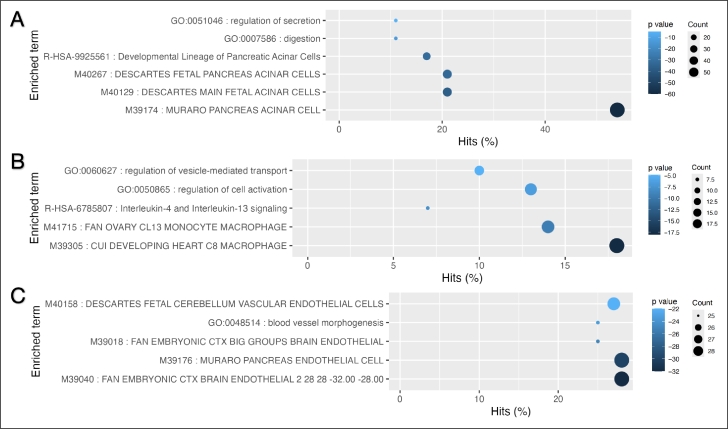
Single-cell RNA sequencing (scRNA-seq) enables high-resolution analysis of cellular heterogeneity, yet accurate and consistent cell-type annotation remains a crucial challenge. Numerous automated tools exist, but their complex modeling assumptions can hinder reliability across varied datasets and protocols. We propose PCLDA, a pipeline composed of three modules: t-test-based gene screening, principal component analysis (PCA) and linear discriminant analysis (LDA), all built on simple statistical methods. An ablation study shows that each module in PCLDA contributes significantly to performance and robustness, with two novel enhancements in the second module yielding substantial gains. Despite these additions, the model retains its original assumptions, computational efficiency, and interpretability. Benchmarking against nine state-of-the-art methods across 22 public scRNA-seq datasets and 35 distinct evaluation scenarios, PCLDA consistently achieves top-tier accuracy under both intra-dataset (cross-validation) and inter-dataset (cross-platform) conditions. Notably, when reference and query data are generated via different protocols, PCLDA remains stable and often outperforms more complex machine-learning approaches. Furthermore, PCLDA offers strong interpretability, attributed to the linear nature of its PCA and LDA modules. The final decision boundaries are linear combinations of the original gene expression values, directly reflecting the contribution of each gene to the classification. Top-weighted genes identified by PCLDA better capture biologically meaningful signals in enrichment analyses than those selected via marginal screening alone, offering deeper functional insights into cell-type specificity. In conclusion, our work underscores the utility of carefully enhanced simple statistics methods for single-cell annotation. PCLDA's simplicity, interpretability, and consistently high performance make it a practical, reliable alternative to more complex annotation pipelines. Code is available on GitHub:https://github.com/kellen8hao/PCLDA.
Keywords: Cell type annotation; Interpretable machine learning; Linear discriminant analysis; Simple statistics; Single-cell genomics.
© 2025 The Authors. Published by Elsevier B.V. on behalf of Research Network of Computational and Structural Biotechnology.
Conflict of interest statement
The authors declare that they have no known competing financial interests or personal relationships that could have appeared to influence the work reported in this paper.
Figures


Similar articles
-
Sexual Harassment and Prevention Training.2024 Mar 29. In: StatPearls [Internet]. Treasure Island (FL): StatPearls Publishing; 2025 Jan–. 2024 Mar 29. In: StatPearls [Internet]. Treasure Island (FL): StatPearls Publishing; 2025 Jan–. PMID: 36508513 Free Books & Documents.
-
Stabilizing machine learning for reproducible and explainable results: A novel validation approach to subject-specific insights.Comput Methods Programs Biomed. 2025 Sep;269:108899. doi: 10.1016/j.cmpb.2025.108899. Epub 2025 Jun 21. Comput Methods Programs Biomed. 2025. PMID: 40570739
-
Leveraging multiple labeled datasets for the automated annotation of single-cell RNA and ATAC data.Comput Struct Biotechnol J. 2025 Jul 1;27:2863-2870. doi: 10.1016/j.csbj.2025.06.043. eCollection 2025. Comput Struct Biotechnol J. 2025. PMID: 40687986 Free PMC article.
-
Automated devices for identifying peripheral arterial disease in people with leg ulceration: an evidence synthesis and cost-effectiveness analysis.Health Technol Assess. 2024 Aug;28(37):1-158. doi: 10.3310/TWCG3912. Health Technol Assess. 2024. PMID: 39186036 Free PMC article.
-
Quality improvement strategies for diabetes care: Effects on outcomes for adults living with diabetes.Cochrane Database Syst Rev. 2023 May 31;5(5):CD014513. doi: 10.1002/14651858.CD014513. Cochrane Database Syst Rev. 2023. PMID: 37254718 Free PMC article.
References
LinkOut - more resources
Full Text Sources