. 2025 Aug;31(8):e70410.
doi: 10.1111/gcb.70410.

Relative Effects of Eutrophication and Warming on Freshwater Ecosystems Across Ecological Levels

Affiliations

Relative Effects of Eutrophication and Warming on Freshwater Ecosystems Across Ecological Levels

Valentin Marin et al. Glob Chang Biol. 2025 Aug.

Abstract

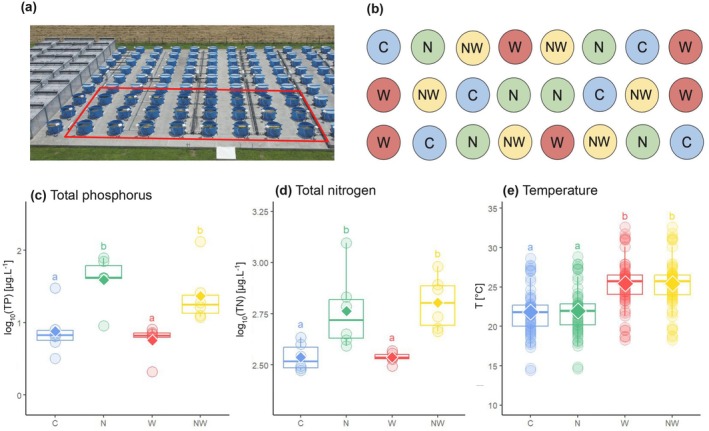
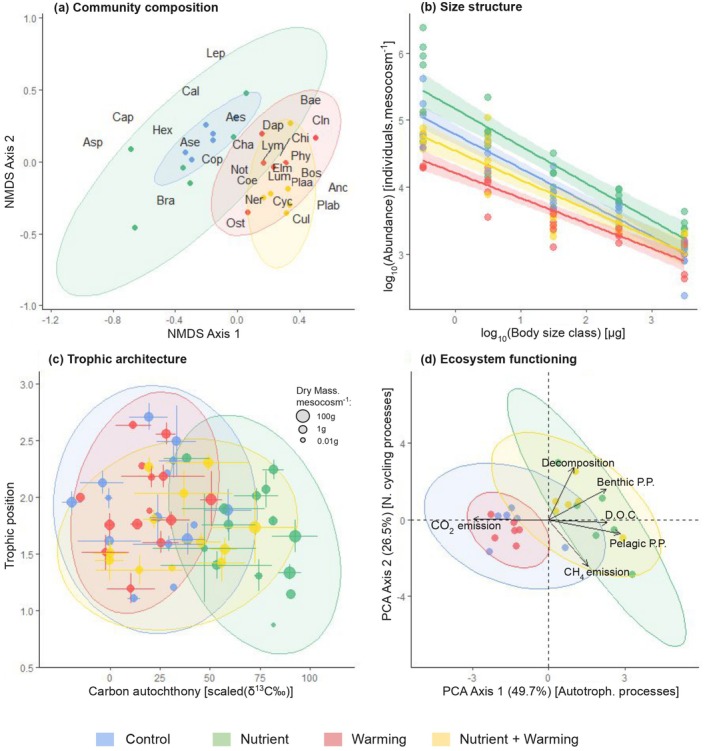
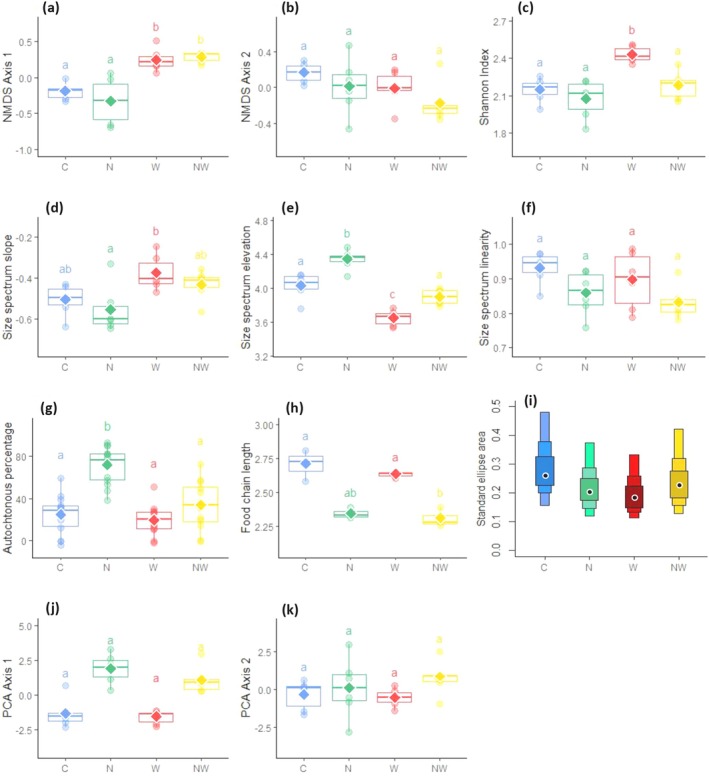
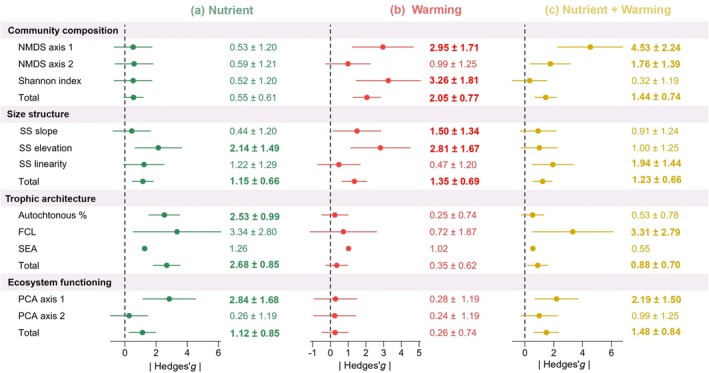
Global change strongly alters biodiversity worldwide, but our ability to predict their consequences for ecosystem functioning remains limited. This lack of knowledge may be attributed to the limited empirical evidence of the simultaneous ecological impacts of global change across multiple ecological levels. Here, we conducted a full factorial experiment to measure the isolated and combined effects of two global change drivers to which freshwater ecosystems are severely exposed: (i) nutrient addition, which mainly affects the lower trophic levels and modifies ecosystems from the bottom of the food chain, and (ii) warming, which primarily affects large organisms at the top of the food chain. We quantified the effects of the two global change drivers at four different ecological levels: community composition (zooplankton and benthic invertebrates), size structure, trophic architecture, and ecosystem functioning. We found that the impacts of treatments varied significantly across different ecological levels. Specifically, community composition was predominantly affected by warming, whereas nutrient addition played a more important role than warming in ecosystem functioning (e.g., primary production and atmospheric CO2 uptake). More importantly, we found that food webs (described using size spectrum and stable isotope structure) represent an integrative ecological level for capturing the effects of the two global change drivers tested, integrating changes in both community structure and ecosystem functioning. These results provide valuable insights into the responses of aquatic ecosystems to global change and reveal the importance of considering multiple ecological levels to improve our understanding of the processes driving the responses of ecosystems to global change.

Keywords: aquatic invertebrates; climate change; eutrophication; food webs; freshwater ecosystems; mesocosms experiment.


Conflict of interest statement

The authors declare no conflicts of interest.

Figures

FIGURE 1
FIGURE 1
Mesocosm platform used in this experiment (red line) (a) and treatment design (b) colored by treatments: Control (C) in blue, nutrient (N) in green, warming (W) in red, and nutrient + warming (NW) in yellow. Total phosphorus (c) and nitrogen (d) concentrations in the water column at the end of the experiment and mean daily water temperature during the experiment (e). Lozenges represent the mean values for each treatment, and different letters indicate significant differences (pairwise t‐test, p < 0.05).
FIGURE 2
FIGURE 2
Effects of treatments at each ecological level. (a) Community composition with the first two non‐metric multidimensional scaling (NMDS) axes of invertebrate consumers (stress = 0.176). Points represent individual mesocosms, colored by treatments, with ellipses indicating the 95% CI for each treatment. (b) Community size spectrum. Points represent abundances per size class in each mesocosm. Solid line represents the mean size spectrum per treatment (95% CI). (c) Trophic architecture. Each point represents the feeding preference of a consumer, defined by its resource origin (autochthonous/allochthonous) and mean trophic position (±SD). Point size corresponds to the mean abundance of each taxon per mesocosm, with ellipses indicating the 95% CI for each treatment. (d) Ecosystem functioning. The two principal component analysis axes in response to treatments. Each point represents a mesocosm, with ellipses indicating the 95% CI for each treatment. Aes, Aeshnidae; Anc, Ancylidae; Ase, Aselidae; Asp, Asplanchnidae; Bae, Baetidae; Bos, Bosminidae; BPP, benthic primary production; Bra, Brachionidae; Cal, Calanoidae; Cap, Capniidae; CH4 em, CH4 emission; Cha, Chaoboridae; Chi, Chironomidae; Cln, Cladocera nauplii; CO2 em, CO2 emission; Coe, Coenagrionidae; Cop, Copepoda nauplii; Cul, Culicidae; Cyc, Cyclopidae; Dap, Daphniidae; Dec, decomposition rate; DOC, dissolved organic carbon; Elm, Elmidae; Hex, Hexarthridae; Lep, Leptocentridae; Lum, Lumbricidae; Lym, Lymneaidae; Ner, Neretidae; Not, Notonectidae; Ost, Ostracoda; Phy, Physidae; Plaa, Planaridae; Plab, Planorbidae; PPP, pelagic primary production.
FIGURE 3
FIGURE 3
Effects of treatments on community composition (a–c), size spectrum parameters (d–f), trophic architecture (g–i), and ecosystem functioning (j, k). Colors represent different treatments with control (C) in blue, nutrient (N) in green, warming (W) in red, and nutrient + warming (NW) in yellow. For standard ellipse area (i), dots represent the estimated size, and boxes represent the 50%, 75%, and 95% confidence intervals. In other cases, lozenges represent the mean value per treatment, and significant differences (p < 0.05) are given by letters.
FIGURE 4
FIGURE 4
Treatment effects across ecological levels. Total effects represent the weighted mean effect sizes for each ecological level. Significant effect sizes (no overlap of confidence interval with 0) are displayed in bold. FCL, food chain length; SEA, standard ellipse area; SS, size spectrum.

Similar articles

References

    1. Arnér, M. , Koivisto S., Norberg J., and Kautsky N.. 1998. “Trophic Interactions in Rockpool Food Webs: Regulation of Zooplankton and Phytoplankton by Notonecta and Daphnia .” Freshwater Biology 39: 79–90. 10.1046/j.1365-2427.1998.00262.x. - DOI
    1. Bastviken, D. , Cole J., Pace M., and Tranvik L.. 2004. “Methane Emissions From Lakes: Dependence of Lake Characteristics, Two Regional Assessments, and a Global Estimate.” Global Biogeochemical Cycles 18, no. 4: 2238. 10.1029/2004GB002238. - DOI
    1. Beaulieu, J. J. , DelSontro T., and Downing J. A.. 2019. “Eutrophication Will Increase Methane Emissions From Lakes and Impoundments During the 21st Century.” Nature Communications 10, no. 1: 1375. 10.1038/s41467-019-09100-5. - DOI - PMC - PubMed
    1. Binzer, A. , Guill C., Brose U., and Rall B. C.. 2012. “The Dynamics of Food Chains Under Climate Change and Nutrient Enrichment.” Philosophical Transactions of the Royal Society, B: Biological Sciences 367, no. 1605: 2935–2944. 10.1098/rstb.2012.0230. - DOI - PMC - PubMed
    1. Binzer, A. , Guill C., Rall B. C., and Brose U.. 2016. “Interactive Effects of Warming, Eutrophication and Size Structure: Impacts on Biodiversity and Food‐Web Structure.” Global Change Biology 22: 220–227. 10.1111/gcb.13086. - DOI - PubMed

LinkOut - more resources