. 2025 Oct;267(2):181-195.
doi: 10.1002/path.6457. Epub 2025 Aug 8.

Spatial transcriptomics exploration of the primary neuroblastoma microenvironment in archived FFPE samples unveils novel paracrine interactions

Affiliations

Spatial transcriptomics exploration of the primary neuroblastoma microenvironment in archived FFPE samples unveils novel paracrine interactions

Joachim T Siaw et al. J Pathol. 2025 Oct.

Abstract

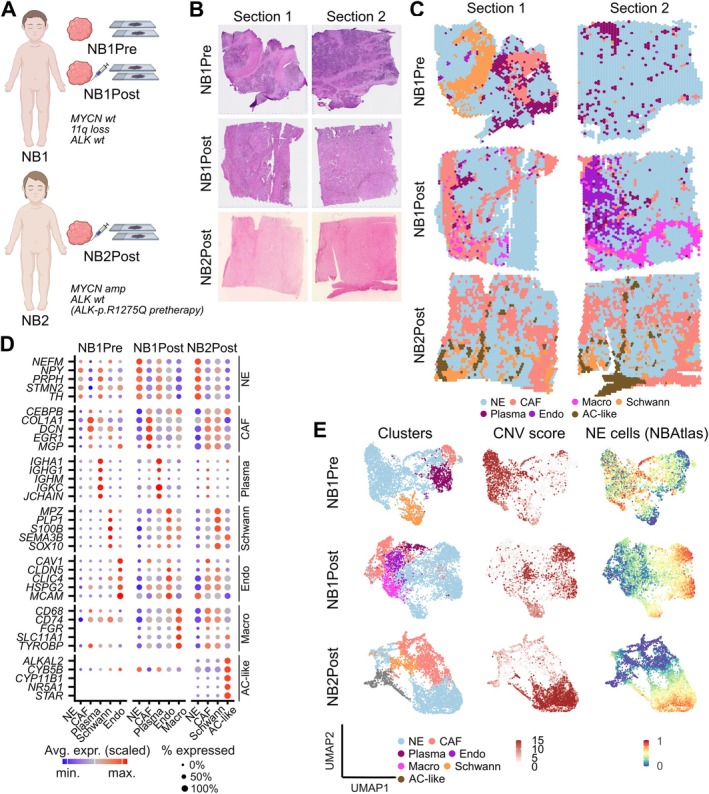
High-risk neuroblastomas exhibit a high degree of intratumoral heterogeneity. Single-cell RNA sequencing has greatly improved our understanding of these tumors, but the method lacks cellular tissue context and spatial information about local signaling dynamics. To address this, we profiled untreated and chemotherapy-treated high-risk neuroblastomas from archived, formalin-fixed, paraffin-embedded (FFPE) tissues from two patients using spatial transcriptomics. We confirmed the transcriptional and cellular heterogeneous nature of the neuroblastoma microenvironment and identified several unique spatial niches and patterns. In one of the treated tumors, a spatially constrained cluster of undifferentiated and 11p-gained cancer cells was identified, surrounded by a rim of macrophages. A signaling interaction between the chemokine CCL18 and its receptor PITPNM3 was predicted between these cells. In the other tumor, we identified a stromal cluster with high transcriptional similarity to the adrenal cortex. These adrenocortical-like cells expressed several oncogenic ligand-encoding genes (e.g. ALKAL2 and NRTN), which were predicted to communicate with neighboring cancer cells that expressed the corresponding receptors (e.g. ALK, RET). Several of these interactions were further validated experimentally and were shown to be clinically relevant. Collectively, our spatial analysis identifies multiple previously unrecognized signaling axes that may offer novel therapeutic options in neuroblastoma. © 2025 The Author(s). The Journal of Pathology published by John Wiley & Sons Ltd on behalf of The Pathological Society of Great Britain and Ireland.


Figures

Figure 1
Figure 1
Spatial transcriptomic profiling of six tumor sections obtained from two NB patients. (A) The Visium spatial transcriptomics platform was used to profile three tumors (two sections each) from two NB patients (NB1 and NB2). Both patients received prior chemotherapy (NB1Post and NB2Post) and for NB1 we also profiled pretherapy tumor materials (NB1Pre). Main genomic alterations indicated. Created in BioRender. Van den Eynden, J. (2025) https://BioRender.com/q78y390. (B) Hematoxylin and eosin (H&E) staining of the six tumor sections that were used in this study. (C) Clustering and annotation of seven main spatial clusters across the six samples. Cluster annotations were based on the most representative cell type, as predicted from marker gene expression, enrichment analyses, and similarities to single‐cell data. See supplementary material, Figures S2 and S3 for details. (D) Dot plots showing relative expression (colors) and proportional expression in the spots (sizes) of the top five representative genes for each cluster, as indicated. Genes derived from the leading edges from the GSEA shown in supplementary material, Figure S2D. (E) UMAP plots showing the main clusters corresponding to each tumor (left), the CNV score, which is representative for the overall copy number variability (center), and the expected proportion of NE cells, as predicted from a deconvolution analysis using the NBAtlas as a reference (right). NE, neuroendocrine cells; CAF, cancer‐associated fibroblasts; Schwann, Schwann cells; Macro, macrophages; Endo, endothelial cells; Plasma, plasma cells; AC‐like, adrenocortical‐like.
Figure 2
Figure 2
Identification of an adrenocortical‐like cell cluster in the NB tumor landscape. Analysis of the cluster annotated as AC‐like in NB2Post tumors. (A) Gene set enrichment running score plots for Reactome gene sets ‘Metabolism of steroids’ and ‘Metabolism of steroid hormones,’ as indicated. p value calculated using a permutation test as implemented in the clusterProfiler R package. See supplementary material, Table S2 for complete GSEA results. (B) Spatial feature plots showing expression of these Reactome gene set signatures (UCell scores) in tumor section 2 of NB2Post. (C) Spatial feature plots of three key adrenocortical marker genes, as indicated. (D) Heatmaps showing the average UCell scores of fetal and postnatal adrenocortical cell type signatures on the main clusters identified in NB2Post. AP, adrenal primordium; FZ, fetal zone; DZ, definitive zone; ZG, zona glomerulosa; ZF, zona fasciculata; ZR, zona reticularis.
Figure 3
Figure 3
Complementary spatial expression patterns between ALKAL2 expressing adrenocortical‐like cells and ALK expressing tumor cells in NB2 post‐tumors. (A) Tumor tissue locations of the AC‐like cells, NE1 cancer cells, and NE2CA cells in both sections of NB2Post tumors, as indicated. (B) Spatial feature plots showing corresponding ALKAL2 and ALK expression. (C) UMAP plots showing human fetal adrenal gland cell subpopulations as previously identified from scRNA‐seq [10]. Blue and brown color gradients indicate ALK and ALKAL2 expression as shown in the color key. Main cell populations labeled. (D) UMAP plots of the adrenocortical cluster of panel C with color gradients indicating different fetal adrenocortical signature scores, as indicated. (E) Immunohistochemistry images of Alkal2‐ and pALK‐stained mice adrenal gland sections, as indicated. Images are representative of n = 3 independent mice. Scale bars, 250 μM. (F) Kaplan–Meier survival plot comparing overall survival between NB patients with high (>90th percentile), intermediate (10th–90th percentile) and low (<10th percentile) AC‐like expression signature, as indicated. p values calculated using the log rank test. (G) Bar plots indicating the percentages of ALKAL2 expressing tumors (left) or MYCN amplified tumors in each AC‐like expression signature group, as indicated. p values calculated using chi‐square test. NB data pooled from four different studies.
Figure 4
Figure 4
Identification of a spatially defined NRTN – GRFA2/RET interaction and experimental validation in NB cells. (A) Chord plot showing the number of predicted outgoing signaling interactions from the AC‐like cluster. Number of interactions with NE1 and NE2‐CA and examples of common interactions given. See supplementary material, Table S3 for detailed results. (B) Spatial gene expression plots showing NRTN, GFRA2, and RET expression in sections, as indicated. (C) Bar plot indicating percentages of NRTN expressing primary NB tumors with high (>90th percentile), intermediate, and low (<10th percentile) AC‐like signatures, as indicated. p values calculated using chi‐square test. (D) Kaplan–Meier survival plots comparing overall survival between NB patients with high (>90th percentile), intermediate (10th–90th percentile), and low (<10th percentile) gene expression, as indicated. p values calculated using the log rank test. (E) Western blot showing expression of GFRA2 in four different NB cell lines, as indicated. Normalized densitometry values indicated below each blot. (F, G) Time‐dependent effect of NRTN (100 ng/ml; n = 3) and/or selpercatinib (500 nm; n = 3) application on (F) relative wound density (RWD; measured using a scratch/wound migration assay), and (G) cell growth (measured on Incucyte S3 system) on different NB cell lines, as indicated. p values for indicated timepoints calculated using an unpaired, two‐sided Student's t‐test.
Figure 5
Figure 5
Intercellular signaling interactions between macrophages and undifferentiated, 11p amplified neuroendocrine cancer cells in NB1Post. (A) Tumor tissue locations of the NE4 cancer cell cluster and the surrounding rim of macrophages in the second section of NB1Post. (B) Bar plot showing the −log10(p adj) values of the 10 most upregulated genes in the NE4 cluster. (C) Spatial expression plots of selected genes, as indicated. (D) Chromosome 11 copy number spot profiles, with genes that are in the top 10 upregulated genes mapped to their chromosomal location (left). Visualization of the average 11p copy number gain signal (right). Copy numbers inferred using inferCNV. (E) Spatial UCell score plots of ‘neuroblasts’ and ‘late neuroblasts’ cell differentiation markers derived from Jansky et al [10]. (F) Bar plot showing −log10(p adj) values of the 10 most upregulated receptor ligand encoding genes in the macrophage cluster. (G) Chord plot showing the number of predicted intercellular incoming signaling interactions in NE4, with several examples indicated. See supplementary material, Table S3 for detailed results. (H) Spatial gene expression plots for selected ligand–receptor interaction pairs.
Figure 6
Figure 6
Experimental and clinical validation of the role of CCL18 in NB. (A) Western blot showing the protein expression profile of the CCL18 receptor PITPNM3 in four NB cell lines, as indicated. Normalized densitometry values indicated below each blot. (B, C) Time‐dependent effect of CCL18 application (100 ng/ml; n = 3) on (B) relative wound density (RWD; measured using a scratch/wound migration assay), and (C) cell growth (measured on Incucyte S3 system) in different NB cell lines, as indicated. p values for indicated timepoints calculated using an unpaired, two‐sided Student's t‐test. (D–F) Survival analysis of CCL18 expression. (D) Kaplan–Meier survival plots comparing overall survival between patients with high (>90th percentile), intermediate (10th–90th percentile), and low (<10th percentile) CCL18 expression, as indicated. p value calculated using the log rank test. (E) Boxplots comparing CCL18 expression between MYCN amplified and MYCN wildtype tumors. p value calculated using the two‐sided unpaired Wilcoxon's test. (F) Forest plots comparing hazard ratios +/− 95% confidence intervals for three variables, as indicated. Results were obtained using a Cox proportional hazards multivariate regression analysis.

References

    1. Maris JM, Hogarty MD, Bagatell R, et al. Neuroblastoma. Lancet 2007; 369: 2106–2120. - PubMed
    1. Park JR, Eggert A, Caron H. Neuroblastoma: biology, prognosis, and treatment. Hematol Oncol Clin North Am 2010; 24: 65–86. - PubMed
    1. Karlsson J, Valind A, Holmquist Mengelbier L, et al. Four evolutionary trajectories underlie genetic intratumoral variation in childhood cancer. Nat Genet 2018; 50: 944–950. - PubMed
    1. Oldridge DA, Truong B, Russ D, et al. Differences in genomic profiles and outcomes between thoracic and adrenal neuroblastoma. J Natl Cancer Inst 2019; 111: 1192–1201. - PMC - PubMed
    1. Mengelbier LH, Karlsson J, Lindgren D, et al. Intratumoral genome diversity parallels progression and predicts outcome in pediatric cancer. Nat Commun 2015; 6: 6125. - PubMed