. 2025 Oct 6;224(10):e202406097.
doi: 10.1083/jcb.202406097. Epub 2025 Aug 8.

Dominant-negative isoform of TDP-43 is regulated by ALS-linked RNA-binding proteins

Affiliations

Dominant-negative isoform of TDP-43 is regulated by ALS-linked RNA-binding proteins

Minami Hasegawa-Ogawa et al. J Cell Biol. .

Abstract

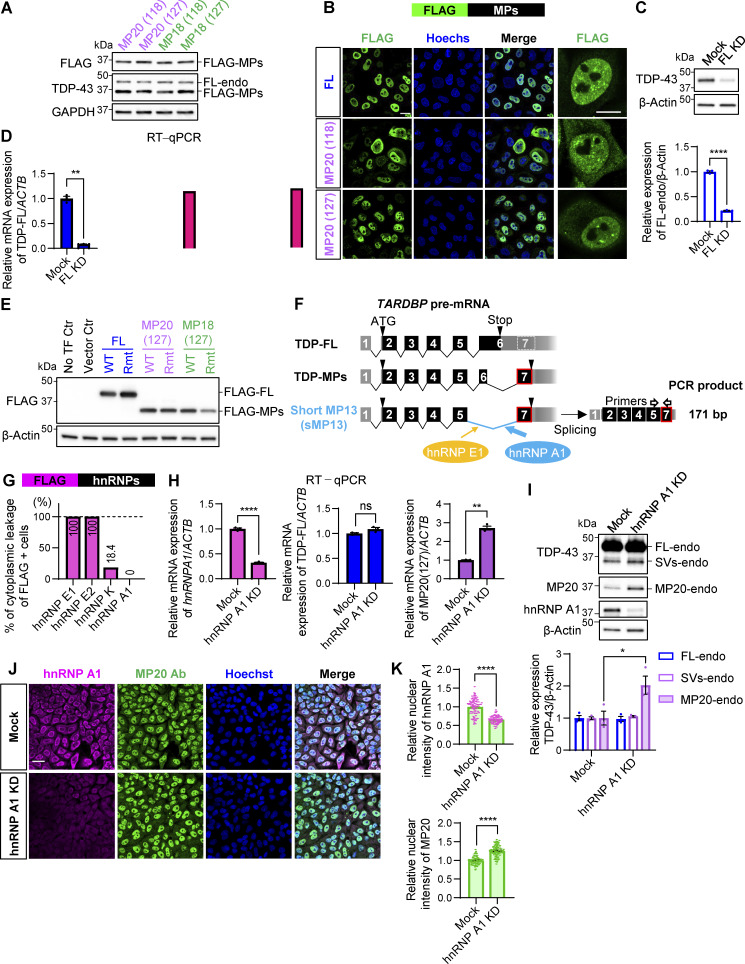
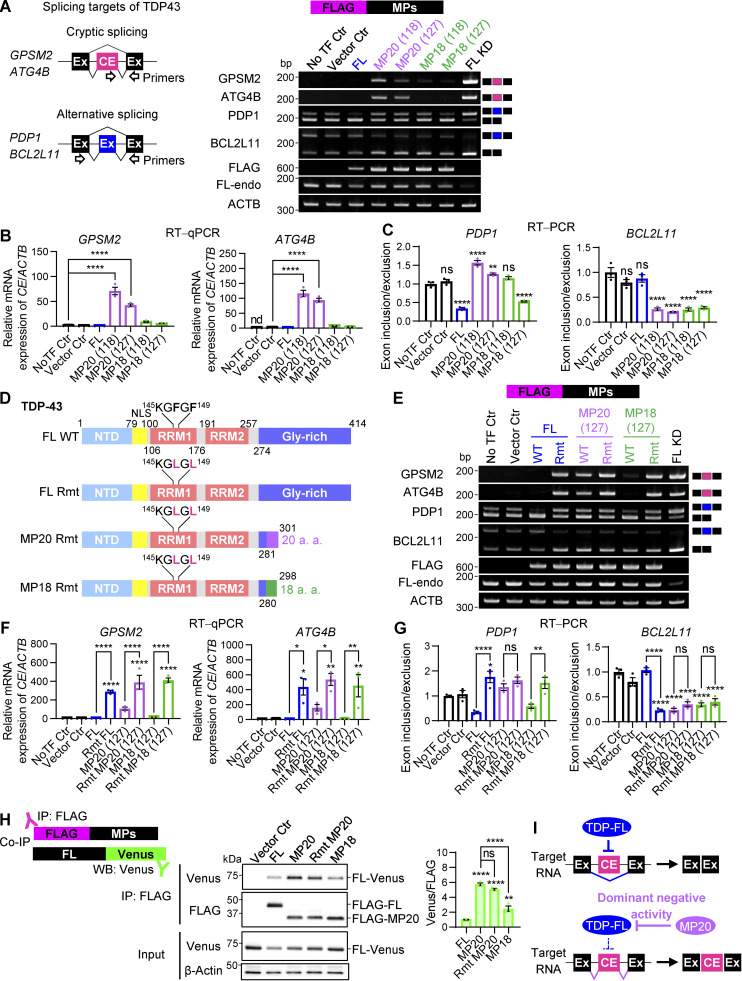
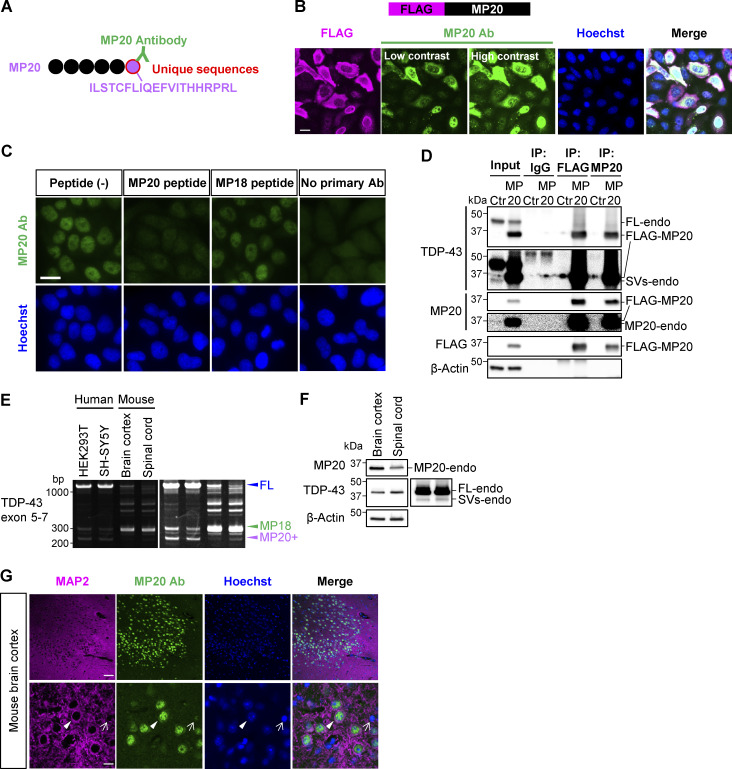
TDP-43, an RNA-binding protein (RBP) encoded by the TARDBP gene, is crucial for understanding the pathogenesis of neurodegenerative diseases like amyotrophic lateral sclerosis (ALS) and frontotemporal lobar degeneration. Dysregulated TDP-43 causes motor neuron loss, highlighting the need for proper expression levels. Here, we identify a dominant-negative isoform among the multiple TARDBP splicing variants and validate its endogenous expression using a developed antibody against its translated product. Furthermore, we revealed that ALS-associated RBPs regulate its expression: hnRNP K promotes its splicing and expression, while hnRNP A1 and FUS suppress these processes through distinct mechanisms. hnRNP A1 inhibits hnRNP K-mediated splicing, and FUS represses the dominant-negative isoform through both its translational inhibition and hnRNP K suppression. Notably, ALS-mutant FUS weakens this regulatory mechanism, leading to impaired repression of hnRNP K and the dominant-negative isoform. Our findings suggest a regulatory network involving ALS-linked RBPs that govern TDP-43 isoform expression and provide new insights into how disruptions in this network contribute to ALS pathogenesis.


Conflict of interest statement

Disclosures: The authors declare no competing interests exist.

Figures

Figure 1.
Figure 1.
Shortened TDP-43 isoforms suppress endogenous TDP-43 expression. (A) Schematic representation of alternative splicing isoforms of TARDBP. Black or gray boxes indicate coding or untranslated regions, respectively. The pale gray box with a dotted outline represents the region that becomes exon 7 through alternative splicing. Orange and blue lines indicate alternative donor and acceptor sites, respectively. Alternative splicing of TARDBP generates TDP-MPs by excluding part of exon 6 from the TDP-FL, resulting in unique C-terminal sequences (light blue, purple, or green circle with red outlines). The red box marks the siRNA target site specific to TDP-FL. (B) WB analysis of HEK293T cells overexpressing TDP-MPs fused to Venus (MPs-Venus). Quantification of endogenous TDP-FL (FL-endo) levels is normalized to β-actin (n = 3 for each group). Controls include no transfection (NoTF Ctr) and empty vector (Vector Ctr). Data represent the mean ± SEM. Statistical significance was evaluated using one-way ANOVA followed by Dunnett’s test. *P < 0.05, **P < 0.01, and ***P < 0.001 compared with the NoTF Ctr group. (C) Immunocytochemical images of HeLa cells overexpressing FLAG-tagged MP20 (127) or MP18 (127) (FLAG-MPs). Endogenous TDP-43 was detected using an antibody against Gly400 (G400), absent in MPs (green). FLAG (magenta) and Hoechst (blue). Arrowheads indicate FLAG-positive cells. Scale bars: 20 μm. Source data are available for this figure: SourceData F1.
Figure S1.
Figure S1.
hnRNP A1 downregulation promotes MP20 expression. (A) WB analysis confirming the expression of FLAG-MPs in HEK293T cells. The anti–TDP-43 antibody detected endogenous TDP-FL (FL-endo) and FLAG-MPs. (B) Subcellular localization of FLAG-MPs in HeLaS3 cells. FLAG (green) and Hoechst (blue). Magnified images of FLAG are shown in the right panels. Scale bars: 20 μm (left) and 10 μm (right). (C) WB analysis of TDP-43 protein levels in HEK293T with TDP-FL KD (FL KD). Data are normalized to β-actin. Statistical analysis was performed using Welch’s t test. (D) RT-qPCR analysis of TDP-FL, GPSM2 CE, and ATG4B CE mRNA levels in HEK293T with FL KD. Data are normalized to ACTB. Statistical analysis was performed using Welch’s t test (n = 3 for each group). (E) WB analysis of FLAG-MPs with Rmt’s (see Fig. 2 E). (F) Schematic representation of the sMP13 isoform of TARDBP, induced by hnRNP A1 and E1. (G) Percentage of cytoplasmic leakage in FLAG-hnRNPs–positive cells. Data present 564 cells per group. (H) RT-qPCR analysis of hnRNP A1, TDP-FL, and MP20 (127) mRNA levels in HEK293T cells with hnRNP A1 KD. Data are normalized to ACTB. Statistical analyses were performed using Welch’s t test (n = 3 for each group). (I) WB analysis of TDP-43 protein levels in HEK293T cells with hnRNP A1 KD. Quantification of FL-endo, SVs-endo, and MP20-endo protein levels is normalized to β-actin. Statistical analyses were performed using Welch’s t test. (J) Immunocytochemistry of HeLaS3 cells with hnRNP A1 KD. hnRNP A1 (magenta), MP20 Ab (green), and Hoechst (blue). Scale bar: 50 μm. (K) Quantification of nuclear hnRNP A1 or MP20 intensity. Data present 100 cells per group. Statistical analyses were performed using Welch’s t test. All graphs show the mean ± SEM. *P < 0.05, **P < 0.01, ***<0.001, and ****P < 0.0001. Ab, antibody. Source data are available for this figure: SourceData FS1.
Figure 2.
Figure 2.
Characterization of dominant-negative TDP-43 isoforms. (A) Schematic representation of RT-PCR analysis for TDP-43–associated cryptic splicing targets (GPSM2 and ATG4B) and alternative splicing events (PDP1 and BCL2L11). Representative RT-PCR results from HEK293T cells overexpressing FLAG-MPs. TDP-FL KD was used as a positive control for CE inclusion and splicing exon inclusion (PDP1) or exclusion (BCL2L11). (B) RT-qPCR analysis of CE inclusion in GPSM2 and ATG4B transcripts in cells expressing FLAG-MPs. ACTB was used for normalization (n = 3 for each group). nd, not detected. (C) Ratios of exon inclusion to exon exclusion for PDP1 and BCL2L11 transcripts were determined via RT-PCR (n = 3 for each group) in cells expressing FLAG-MPs. (D) Schematic representation of TDP-FL, MP20, MP18, and their RRM domain mutants (Rmt). (E) Representative RT-PCR results of the TDP-43–associated splicing targets in HEK293T cells overexpressing FLAG-Rmt isoforms. (F) RT-qPCR analysis of CE inclusion in GPSM2 and ATG4B transcripts in cells expressing FLAG-Rmt isoforms. ACTB was used for normalization (n = 3 for each group). (G) Ratios of exon inclusion to exon exclusion for PDP1 and BCL2L11 transcripts in cells expressing FLAG-Rmt isoforms (n = 3 for each group). (H) Co-IP analysis of FLAG-MPs and TDP-FL fused to Venus (FL-Venus) in HEK293T cells. FLAG IP was performed, and Venus levels were normalized to FLAG signals (n = 3 for each group). (I) Proposed model of dominant-negative effects exerted by TDP-MP20 on splicing regulation. In B and C, data were analyzed using one-way ANOVA followed by Dunnett’s test. In F, G, and H, data were analyzed using one-way ANOVA followed by Tukey’s test. Error bars represent mean ± SEM. *P < 0.05, **P < 0.01, and ****P < 0.0001. Gly-rich, glycine-rich region; NLS, nuclear localization signal. Source data are available for this figure: SourceData F2.
Figure 3.
Figure 3.
ALS pathophysiologyassociated RBPs induce the production of a dominant-negative splicing isoform of TARDBP. (A) Schematic representation of alternative splicing isoforms of TARDBP and corresponding PCR product sizes. Black-framed arrows indicate the primer locations used for RT-PCR analysis of exons 5–7. For RT-qPCR, TaqMan MGB probes (magenta boxes) and primer sets specifically targeting TDP-FL or MP20 (127) transcripts are shown. (B) Representative RT-PCR results of TARDBP splicing in HEK293T cells overexpressing FLAG-RBPs, including ALS-causative RBPs (TDP-FL, FUS, and hnRNP A1), neuron-specific RBPs (ELAVL3 and NOVA1), and RBPs associated with ALS pathophysiology (hnRNP K, hnRNP E1, and hnRNP E2). A schematic of the sMP13 isoform is also provided in Fig. S1 F. (C) Quantification of MP20+ band ratios from B based on RT-PCR analysis. The band intensities were quantified from three independent experiments. (D) Relative proportions of MP20+ isoforms determined through sequencing analysis of PCR bands in cells with or without FLAG-hnRNP K overexpression. Analysis included 19 cloned colonies per condition. Dashed lines indicate the MP20+ proportion observed in the NoTF control. (E) RT-qPCR analysis of TDP-FL and MP20 (127) mRNA levels in HEK293T cells overexpressing FLAG-hnRNP K. Data are normalized to ACTB expression (n = 3 for each group). (F) Representative RT-PCR images of TARDBP splicing in HEK293T cells with hnRNP K KD. (G) RT-qPCR quantification of hnRNP K, TDP-FL, and MP20 (127) mRNA levels in hnRNP K KD cells. Data are normalized to ACTB expression (n = 3 for each group). Statistical analyses were performed using one-way ANOVA followed by Dunnett’s test (E) or Welch’s t test (G). All graphs display mean ± SEM. *P < 0.05 and ****P < 0.0001. (H) Schematic illustrating how hnRNP K promotes the splicing of TARDBP to generate the MP20 (127) isoform. Source data are available for this figure: SourceData F3.
Figure 4.
Figure 4.
Quality evaluation of a polyclonal antibody against endogenous TDP-MP20. (A) Schematic representation of MP20 antibody (MP20 Ab) recognizing a unique C-terminal peptide sequence of MP20. (B) Immunocytochemistry results showing FLAG-MP20 overexpression in HeLaS3 cells. MP20 Ab (green), FLAG (magenta), and Hoechst (blue). Scale bar: 20 μm. (C) Immunocytochemistry showing MP20-endo staining in HeLaS3 cells, using a peptide-absorbed MP20 Ab (green) and Hoechst (blue). MP18 peptide served as a negative control. Scale bar: 20 μm. (D) IP analysis of FLAG-MP20–overexpressing HEK293T cells using FLAG or MP20 Ab. An anti-IgG Ab was used as a negative control. Endogenous TDP-43 SVs (SVs-endo) include cleaved FL-endo and variants derived from short isoforms. (E) RT-PCR results comparing TARDBP splicing patterns in human cell lines (HEK293T and SH-SY5Y), adult mouse (11 mo old, male) brain cortex, and spinal cord. (F) WB analysis of MP20 expression in adult mouse (22 mo old, male) brain cortex and spinal cord. (G) Fluorescent immunostaining of adult mouse (22 mo old, male) brain cortex, stained with MP20 (green), MAP2 (magenta), and Hoechst (blue). Arrowheads and arrows denote MAP2-positive and MAP2-negative cells, respectively. Scale bar: 50 μm (upper panel), 10 μm (lower panel). Source data are available for this figure: SourceData F4.
Figure 5.
Figure 5.
hnRNP K induces the protein expression of endogenous TDP-MP20. (A) Immunocytochemistry of HeLaS3 cells overexpressing FLAG-hnRNPs. MP20-endo (green), FLAG (magenta), and Hoechst (blue). Yellow boxes indicate magnified images (scale bar: 10 μm). Arrowheads and arrows denote FLAG-positive and FLAG-negative cells, respectively. Scale bar: 50 μm. (B) Quantification of nuclear MP20 fluorescence intensity in FLAG-hnRNPs–positive cells. A total of 100 FLAG-positive and 100 FLAG-negative cells per group were analyzed. Fluorescence signals were normalized to the average intensity of 400 FLAG-negative cells. Statistical analysis was performed using one-way ANOVA followed by Dunnett’s test. (C) Comparison of nuclear MP20 signals in cells with FLAG-hnRNP K localized in the nucleus only (Nuc) versus in both the cytoplasm and nucleus (Cyto+Nuc). Nuc: 123 cells; Cyto+Nuc: 177 cells. Welch’s t test was used for statistical analysis. (D and E) WB analysis of HEK293T cells overexpressing FLAG-hnRNPs (D) or with hnRNP K KD (E). Quantification of the relative expression of FL-endo, SVs-endo, and MP20-endo (n = 3 for each group). Data are normalized to β-actin. Statistical analyses were performed using one-way ANOVA followed by Dunnett’s test (D) or Welch’s t test (E). (F) IP of FLAG-hnRNP K overexpressed in HEK293T cells using MP20 or FLAG Ab, with or without peptide absorption by MP20- or MP18-immunizing peptides. An anti-IgG Ab was used as a negative control. All graphs show the mean ± SEM. *P < 0.05, **P < 0.01, and ****P < 0.0001. Ab, antibody. Source data are available for this figure: SourceData F5.
Figure 6.
Figure 6.
hnRNP K enhances hnRNP A1 expression. (A) WB analysis of HEK293T cells overexpressing FLAG-hnRNP K. Quantification of relative expression levels of hnRNP A1 and hnRNP A2/B1 is shown (n = 3 for each group). (B) Immunocytochemistry of HeLaS3 cells overexpressing FLAG-hnRNP K. FLAG (magenta), hnRNP A1 or hnRNP A2/B1 (green), and Hoechst (blue). Arrowheads indicate FLAG-positive cells, while arrows indicate FLAG-negative cells. Scale bar: 10 μm. (C) Quantification of nuclear hnRNP A1 or hnRNP A2/B1 fluorescence intensity in FLAG-hnRNP K–positive and –negative cells. A total of 100 FLAG-positive and 100 FLAG-negative cells per group were analyzed. Statistical analyses were performed using Welch’s t test. (D) Comparison of nuclear hnRNP A1 or hnRNP A2/B1 fluorescence intensity in cells with FLAG-hnRNP K localized only in the nucleus (Nuc) versus in both the cytoplasm and nucleus (Cyto+Nuc). For hnRNP A1, Nuc: 52 cells, Cyto+Nuc: 48 cells; for hnRNP A2/B1, Nuc: 64 cells, Cyto+Nuc: 35 cells. Statistical analyses were performed using Welch’s t test. (E) WB analysis of HEK293T cells with hnRNP K KD. Quantification of relative expression levels of hnRNP K or hnRNP A1 is shown (n = 3 for each group). In A and E, data are normalized to β-actin. Statistical analyses were performed using one-way ANOVA followed by Dunnett’s test (A) or Welch’s t test (E). All graphs show the mean ± SEM. *P < 0.05, **P < 0.01, ***P < 0.001, and ****P < 0.0001. Source data are available for this figure: SourceData F6.
Figure S2.
Figure S2.
hnRNP K levels are not influenced by hnRNP A1 expression. (A–C) RT-qPCR analysis of hnRNP A1 (A and B) and hnRNP K (C) mRNA levels in HEK293T cells overexpressing FLAG-hnRNP K (A) or with hnRNP K KD (B) or overexpressing hnRNP A1 (C). Data are normalized to ACTB. Statistical analyses were performed using one-way ANOVA followed by Tukey’s test (A and C) or Welch’s t test (B), respectively (n = 3 for each group). (D) WB analysis of HEK293T cells overexpressing FLAG-hnRNP A1. Quantification of hnRNP K is normalized to β-actin. Statistical analysis was performed using one-way ANOVA followed by Tukey’s test (n = 3 for each group). (E) Immunocytochemistry of HeLaS3 cells overexpressing FLAG-hnRNP K. FLAG (magenta), hnRNP A1 (green), and Hoechst (blue). Arrowheads and arrows indicate FLAG-positive and FLAG-negative cells, respectively. Scale bar: 10 μm. (F) WB analysis of HEK293T cells with hnRNP A1 KD. Quantification of hnRNP A1 and hnRNP K is normalized to β-actin. Statistical analyses were performed using Welch’s t test (n = 3 for each group). (G) RT-qPCR analysis of hnRNP K mRNA levels in HEK293T cells overexpressing FLAG-hnRNP A1. Data are normalized to ACTB. Statistical analysis was performed using Welch’s t test (n = 3 for each group). (H) IP of FLAG-hnRNP A1–overexpressing HEK293T cells. FLAG antibody was used for IP, and endogenous hnRNP K was detected by WB. An anti-IgG antibody was used as a negative control for IP. (I–K) Schematic diagram showing conditions with excess hnRNP K (I), hnRNP A1 (J), or hnRNP K coexpressed with hnRNP A1 (K). All graphs show the mean ± SEM. *P < 0.05, **P < 0.01. Source data are available for this figure: SourceData FS2.
Figure 7.
Figure 7.
hnRNP A1 inhibits the effect of hnRNP K on the alternative splicing of TARDBP. (A) Schematic representation of the mini-gene containing TARDBP exon 5 to exon 6 (1–2,100 nt) (mini-gene Ex5-Int5-Ex6) and the spliced PCR product length. Black-framed arrows indicate the primer locations for FLAG amplification to exon 7 of TARDBP. Exons and intron 5 (Int 5) are shown as white boxes with black lines, while the pale gray box with a dotted line represents the region that becomes exon 7 through alternative splicing. Orange and blue lines represent alternative donor (D) and acceptor (A) sites, respectively. (B) RT-PCR images showing TARDBP mini-gene splicing in cells overexpressing FLAG-hnRNP K and FLAG-hnRNP A1 at different doses. (C and D) RT-PCR images of endogenous TARDBP splicing (C) or RT-qPCR analysis of TDP-FL and MP20(127) mRNA levels (D) in HEK293T cells co-overexpressing FLAG-hnRNP K and FLAG-hnRNP A1. (E) WB analysis of HEK293T cells co-overexpressing FLAG-hnRNP K and FLAG-hnRNP A1. (F) Schematic diagram of hnRNP A1 RRM1 or RRM2 domain mutants (R1mt and R2mt). (G) RT-PCR images of endogenous TARDBP splicing in HEK293T cells coexpressing FLAG-hnRNP A1 mutants (R1mt or R2mt) with or without FLAG-hnRNP K. (H) RT-qPCR analysis of TDP-FL and MP20 (127) mRNA expression levels. In D and H, data are normalized to ACTB. Statistical analyses were performed using one-way ANOVA followed by Tukey’s test (n = 3 for each group). (I) WB analysis of HEK293T cells co-overexpressing FLAG-hnRNP A1 RRM domain mutants (R1mt or R2mt) and FLAG-hnRNP K. In E and I, quantification of relative expression levels of FL-endo, SVs-endo, and MP20-endo is shown (n = 3 for each group). Data are normalized to β-actin, and statistical analyses were performed using one-way ANOVA followed by Tukey’s test (E) or Dunnett’s test (I). All graphs show the mean ± SEM. *P < 0.05, **P < 0.01, ***P < 0.001, and ****P < 0.0001. Gly-rich, glycine-rich region; RGG, arginine-glycine-glycine repetitive region. Source data are available for this figure: SourceData F7.
Figure S3.
Figure S3.
Responsible region of hnRNP A1 on TARDBP exon 6 splicing is not found in TARDBP intron 5 and cryptic intron 6. (A) Schematic representation of a mini-gene containing exon 6 (1–2,100) (Ex6) or exon 5 to exon 6 (Ex5-Int5-Ex6) of TARDBP. A potential hnRNP A1 consensus site is indicated in the Ex5-Int5-Ex6 mini-gene. Orange or blue lines show alternative donor (D) or acceptor (A) sites, respectively, and magenta lines indicate the stop codon of FL. (B) RT-PCR images showing the effect of hnRNP A1 on splicing of the mini-gene (Ex5-Int5-Ex6) with deletion of the potential hnRNP A1 consensus sequence in HEK293T cells. (C and E) Schematic representation of deletion mutants of the TARDBP mini-gene (Ex5-Int5-Ex6). Green-filled box indicates polypyrimidine tract (PPT). (D and F) RT-PCR images of HEK293T cells coexpressing TARDBP mini-genes (Ex5-Int5-Ex6) with or without hnRNP A1. Source data are available for this figure: SourceData FS3.
Figure 8.
Figure 8.
The induction of endogenous TDP-MP20 expression by hnRNP K correlates with that of hnRNP A1. (A) Schematic representation of hnRNP K with KH or KI/KNS domain deletion (Del KH, Del KI/KNS) or with KH domain mutations (KHmt). (B and C) RT-PCR images of TARDBP splicing (B) or RT-qPCR analysis of TDP-FL and MP20 (127) mRNA expression levels (C) in HEK293T cells overexpressing hnRNP K deletion mutants. (D) WB of HEK293T cells overexpressing deletion mutants of hnRNP K. (E and F) RT-PCR images of TARDBP splicing (E) or RT-qPCR analysis of TDP-FL and MP20 (127) mRNA expression levels (F) in HEK293T cells overexpressing KHmts. In C and F, data are normalized to ACTB. Statistical analyses were performed using one-way ANOVA followed by Tukey’s test. (G) WB of HEK293T cells overexpressing KHmts. In D and G, quantification of the relative expression of FL-endo, SVs-endo, MP20-endo, hnRNP A1, and hnRNP A2/B1 is shown, respectively. Data are normalized to β-actin. Statistical analyses were performed using one-way ANOVA followed by Tukey’s test (n = 3 for each group). All graphs show the mean ± SEM. *P < 0.05, **P < 0.01, ***P < 0.001, and ****P < 0.0001 compared with the NoTF Ctr group, and #P < 0.05, ##P < 0.01, ###P < 0.001, and ####P < 0.0001 compared with the WT hnRNP K group. NoTF Ctr, nontransfected control; NLS, nuclear localization signal. Source data are available for this figure: SourceData F8.
Figure S4.
Figure S4.
The GC-rich sequence immediately downstream of the TDP- FL-stop in TARDBP is crucial for controlling sensitivity to hnRNP K. (A) Schematic representation of a mini-gene containing exon 6 (1–2,100) (Ex6) of TARDBP. Two potential hnRNP K consensus sites (K-1 and K-2) are described. Orange or blue lines show alternative donor (D) and acceptor (A) sites, and magenta lines indicate the stop codon of FL. (B) RT-PCR images of the effect of hnRNP K on splicing of the mini-gene (Ex6) with deletion of the potential hnRNP K consensus sequence in HEK293T cells. (C and E) Schematic representation of systematic deletion mutants of the TARDBP mini-gene (Ex6). Green box indicates polypyrimidine tract (PPT). A dotted square in E indicates 485–584 residues in exon 6, annotated with FL-stop (magenta), GU-rich (light blue), and AU-rich (purple) residues, respectively. (D and F) RT-PCR images of HEK293T cells coexpressing the TARDBP mini-genes (Ex6) with or without hnRNP K. Source data are available for this figure: SourceData FS4.
Figure 9.
Figure 9.
ALS-associated mutant FUS exhibits a restricted capacity to suppress the expression of hnRNP K and MP20. (A) Comparison of sequences downstream of the FL-stop in exon 6 529–585 in TARDBP between humans and mice. Annotated with FL-stop (magenta), GU-rich (light blue), and AU-rich region (purple), respectively. Magenta lines and square box indicate the FUS-binding consensus reported previously. (B) Schematic representation of the FUS with P525L mutation. (C) RT-qPCR analysis of relative mRNA expression of MP20 (127), TDP-FL, and hnRNP K in HEK293T cells overexpressing FLAG-FUS. Data are normalized to ACTB. Statistical analyses were performed using one-way ANOVA followed by Tukey’s test (n = 3 for each group). (D) WB of HEK293T cells overexpressing FLAG-FUS. Quantification of relative expression of hnRNP K (n = 3 for each group). (E) Immunocytochemistry of HeLaS3 cells overexpressing FLAG-FUS. HnRNP K (green), FLAG (magenta), and Hoechst (blue). Arrowheads or arrows indicate FLAG-positive or FLAG-negative cells, respectively. Scale bar: 10 μm. Quantification of the fluorescence intensity of nuclear hnRNP K in FLAG-FUS–positive cells (right). (F) WB of HEK293T cells overexpressing FLAG-FUS. Quantification of relative expression of MP20-endo (n = 3 for each group). In D and F, data are normalized to β-actin. Statistical analyses were performed using one-way ANOVA followed by Tukey’s test. (G) Immunocytochemistry of HeLaS3 cells overexpressing FLAG-FUS. MP20 (green), FLAG (magenta), and Hoechst (blue). Arrowheads or arrows indicate FLAG-positive or FLAG-negative cells, respectively. Scale bar: 10 μm. Quantification of the fluorescence intensity of nuclear MP20 in FLAG-FUS–positive cells (right). In E and G, a total of 100 FLAG-positive and 100 FLAG-negative cells per group were analyzed. Fluorescence signals were normalized to the average intensity of 200 FLAG-negative cells. Statistical analysis was performed using Welch’s t test. (H) Comparison of sequences downstream of the MP20 stop codon in exon 6 1,198–1,246 in TARDBP between humans and mice. Annotated with MP20 stop codon (magenta) and GU-rich (light blue), respectively. The magenta lines and square box indicate the FUS-binding consensus reported previously. All graphs show the mean ± SEM. *P < 0.05, **P < 0.01, ***P < 0.001, and ****P < 0.0001. Ab, antibody; RMM, RNA recognition motif; ZnF, zinc finger; NES, nuclear export signal; NLS, nuclear localization signal; QSYG, glutamine-glycine-serine-tyrosine-rich domain. Source data are available for this figure: SourceData F9.
Figure S5.
Figure S5.
FUS interacts with TARDBP RNA and regulates translation through the MP20 3′UTR. (A) Schematic representation of UV cross-linking (UV Xlink) and IP followed by RT-PCR. UV Xlink was performed, and IP using an anti-FUS antibody isolated the FUS–RNA complex from HEK293T cells. Subsequent RT-PCR analysis showed whether endogenous FUS associates with TARDBP RNA. (B) Schematic diagram of FUS-binding consensus sequences on TARDBP exon 6. Green circles represent GGUG (Iko et al., 2004; Lerga et al., 2001), and dark green circles represent GUGGU (Lagier-Tourenne et al., 2012). Detection of TARDBP RNA after UV Xlink and IP was achieved using primers targeting exon 6 (410–566, black bold line). Orange and blue lines show alternative donor and acceptor sites, respectively, while magenta lines indicate the FL-stop. (C) UV Xlink followed by IP, and RT-PCR images showing IP validation. An anti-IgG antibody was used as a negative control for IP. (D) Quantification of FL-endo or SVs-endo protein levels from the WB analysis in Fig. 9 F. Data are normalized to β-actin. Statistical analyses were performed using one-way ANOVA followed by Tukey’s test (n = 3 for each group). (E) Schematic diagram of the MP20 3′UTR construct. TARDBP exon 6 (1,205–1,940) was inserted downstream of Venus, while Venus alone was used as control construct. (F and G) WB analysis showing the dose-dependent effect of FLAG-WT FUS (F) or FLAG-P525L FUS mutant (G) on each Venus reporter construct. Quantification of Venus in F and G is normalized to β-actin. Statistical analyses were performed using one-way ANOVA followed by Dunnett’s test. All graphs show the mean ± SEM. *P < 0.05. Source data are available for this figure: SourceData FS5.
Figure 10.
Figure 10.
Schematic representation of the negative feedback system regulating TDP-43 function through FUS, hnRNP K, and hnRNP A1. (A) The binding consensus of FUS is widely present in TARDBP exon 6, including the 3′ UTR of MP20. FUS may inhibit the translation of MP20 by interacting with TARDBP RNA. (B) HnRNP K promotes splicing to MP20 while inhibiting FL, leading to the induction of MP20 expression with dominant-negative activity. WT FUS inhibits MP20 expression via multifaceted mechanism: by inhibiting hnRNP K expression and directly suppressing the posttranscriptional process of MP20. FUS seems to promote the increase of MP20 RNA levels, although its exact mechanism remains unclear. (C) The ALS-causing mutant FUS (P525L) not only increases MP20 RNA but also leads to the dysrepression of MP20 at each regulatory point, potentially affecting TDP-FL expression and function due to its aberrant dominant-negative activity. (D) Our study indicates a negative feedback mechanism in which hnRNP A1 is induced to counteract the effects of hnRNP K, which inhibits canonical TDP-43. These findings suggest that abnormalities in any of the RBPs involved in this regulatory system could result in dysfunction of TDP-43.

Similar articles

References

    1. Afroz, T., Hock E.M., Ernst P., Foglieni C., Jambeau M., Gilhespy L.A.B., Laferriere F., Maniecka Z., Plückthun A., Mittl P., et al. 2017. Functional and dynamic polymerization of the ALS-linked protein TDP-43 antagonizes its pathologic aggregation. Nat. Commun. 8:45. 10.1038/s41467-017-00062-0 - DOI - PMC - PubMed
    1. Akçimen, F., Lopez E.R., Landers J.E., Nath A., Chiò A., Chia R., and Traynor B.J.. 2023. Amyotrophic lateral sclerosis: Translating genetic discoveries into therapies. Nat. Rev. Genet. 24:642–658. 10.1038/s41576-023-00592-y - DOI - PMC - PubMed
    1. An, H., Skelt L., Notaro A., Highley J.R., Fox A.H., La Bella V., Buchman V.L., and Shelkovnikova T.A.. 2019. ALS-linked FUS mutations confer loss and gain of function in the nucleus by promoting excessive formation of dysfunctional paraspeckles. Acta Neuropathol. Commun. 7:7. 10.1186/s40478-019-0658-x - DOI - PMC - PubMed
    1. Angarola, B.L., and Anczuków O.. 2021. Splicing alterations in healthy aging and disease. Wiley Interdiscip. Rev. RNA. 12:e1643. 10.1002/wrna.1643 - DOI - PMC - PubMed
    1. Arai, T., Hasegawa M., Akiyama H., Ikeda K., Nonaka T., Mori H., Mann D., Tsuchiya K., Yoshida M., Hashizume Y., and Oda T.. 2006. TDP-43 is a component of ubiquitin-positive tau-negative inclusions in frontotemporal lobar degeneration and amyotrophic lateral sclerosis. Biochem. Biophys. Res. Commun. 351:602–611. 10.1016/j.bbrc.2006.10.093 - DOI - PubMed

MeSH terms

Substances