. 2025 Aug 8;16(1):1508.
doi: 10.1007/s12672-025-03291-8.

Comprehensive Mendelian randomization analysis of inflammatory networks in diabetic nephropathy and pituitary adenoma: unveiling complex causal relationships

Affiliations

Comprehensive Mendelian randomization analysis of inflammatory networks in diabetic nephropathy and pituitary adenoma: unveiling complex causal relationships

Yi Fu et al. Discov Oncol. .

Abstract

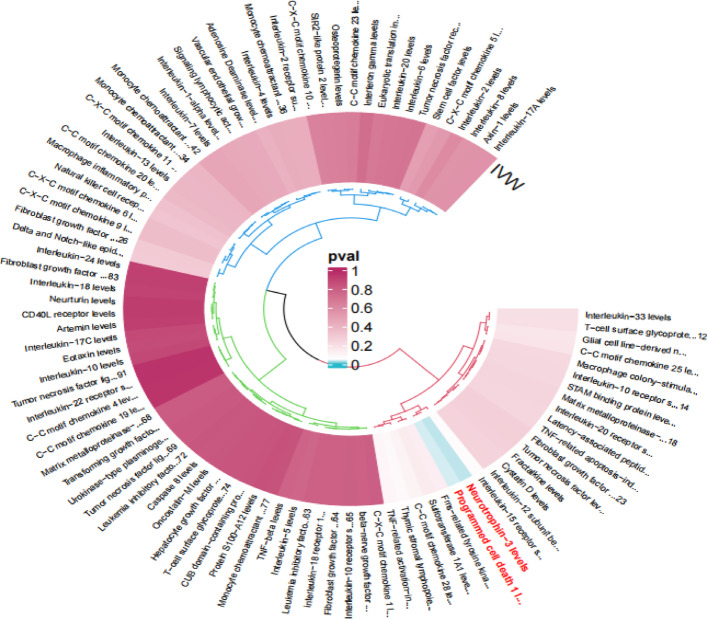
Background: The intricate relationships between inflammatory pathways, diabetic nephropathy, and pituitary adenomas remain poorly understood. This study aimed to comprehensively investigate the causal associations between inflammatory factors, diabetic nephropathy, and pituitary adenoma risk using Mendelian randomization approaches.

Methods: We conducted a systematic Mendelian randomization analysis employing multiple statistical methods including inverse variance weighted (IVW), MR-Egger, and weighted mode approaches. A comprehensive inflammatory factor profile encompassing cytokines, chemokines, growth factors, and immunoregulatory molecules was analyzed. Sensitivity analyses including scatter plots and funnel plots were performed to validate the robustness of causal inferences.

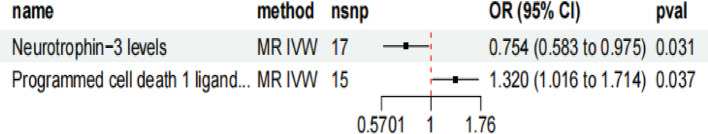
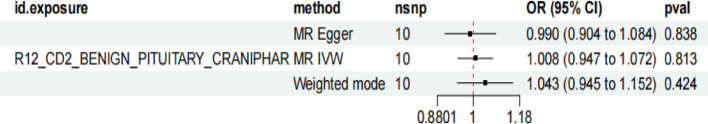
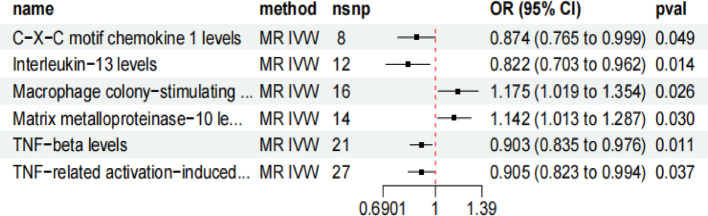
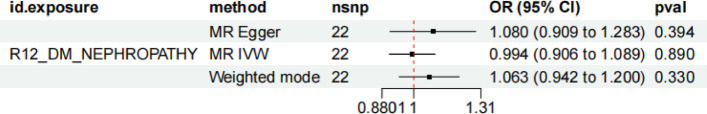
Results: The panoramic analysis revealed distinct inflammatory signatures associated with disease risk. For pituitary adenomas, Neurotrophin-3 demonstrated significant protective effects (OR = 0.754, 95% CI: 0.583-0.975, P = 0.031), while programmed cell death 1 ligand emerged as a risk factor (OR = 1.320, 95% CI: 1.016-1.714, P = 0.037). Regarding diabetic nephropathy, six inflammatory factors showed significant associations: CX3C-motif chemokine 1 (OR = 0.514, P = 0.049), interleukin-13 (OR = 0.822, P = 0.014), TNF-beta (OR = 0.903, P = 0.011), and TNF-related activation-induced cytokine (OR = 0.905, P = 0.037) exhibited protective effects, whereas macrophage colony-stimulating factor (OR = 1.175, P = 0.026) and matrix metalloproteinase-10 (OR = 1.142, P = 0.030) increased disease risk. Notably, no significant causal relationship was observed between diabetic nephropathy and pituitary adenoma risk across all analytical methods.

Conclusions: This comprehensive Mendelian randomization analysis reveals complex, disease-specific inflammatory networks underlying diabetic nephropathy and pituitary adenoma pathogenesis.

Keywords: Causal inference; Diabetic nephropathy; Inflammatory factors; Mendelian randomization; Pituitary adenoma.


Conflict of interest statement

Declarations. Ethics approval and consent to participate: Not available. Consent for publication: Not available. Competing interests: The authors declare no competing interests.

Figures

Fig. 1
Fig. 1
Forest plot of Mendelian randomization analysis for inflammatory factors and pituitary adenoma risk. Causal relationships between inflammation-related factors and pituitary adenoma risk were analyzed using the inverse variance weighted (MR IVW) method. The horizontal axis represents odds ratios (OR) with 95% confidence intervals, and the vertical axis shows the analyzed factors. OR < 1 indicates protective factors, while OR > 1 indicates risk factors. nsnp number of instrumental variables, pval P-value
Fig. 2
Fig. 2
Circular plot of panoramic Mendelian randomization analysis for inflammatory factors and pituitary adenoma risk. The circular plot displays the results of Mendelian randomization analysis between inflammation-related biomarkers and pituitary adenoma risk. The outer ring shows the names of inflammatory factors, while the inner ring color-coding represents P-values (see color scale on the right), with red indicating significant associations (P < 0.05). The analysis encompasses multiple classes of inflammatory mediators including cytokines, chemokines, and growth factors
Fig. 3
Fig. 3
Forest plot of Mendelian randomization analysis for benign pituitary tumors and diabetic nephropathy risk. Three Mendelian randomization methods (MR Egger, inverse variance weighted, and weighted mode) were used to analyze the causal relationship between benign pituitary craniopharyngioma and diabetic nephropathy risk. The horizontal axis represents odds ratios (OR) with 95% confidence intervals. All OR values are close to 1 with P-values > 0.05, indicating no significant causal association. nsnp number of instrumental variables, pval P-value
Fig. 4
Fig. 4
Forest plot of Mendelian randomization analysis for inflammatory factors and diabetic nephropathy risk. Causal relationships between inflammation-related factors and diabetic nephropathy risk were analyzed using the inverse variance weighted (MR IVW) method. The horizontal axis represents odds ratios (OR) with 95% confidence intervals. OR < 1 indicates protective factors, while OR > 1 indicates risk factors. All displayed factors reached statistical significance (P < 0.05). nsnp number of instrumental variables, pval P-value
Fig. 5
Fig. 5
Forest plot of Mendelian randomization analysis for diabetic nephropathy and pituitary adenoma risk. Three Mendelian randomization methods (MR Egger, inverse variance weighted, and weighted mode) were used to analyze the causal relationship between diabetic nephropathy and pituitary adenoma risk. Based on 22 instrumental variables, the horizontal axis represents odds ratios (OR) with 95% confidence intervals. All OR values are close to 1 with P-values > 0.05, indicating no significant causal association. nsnp number of instrumental variables, pval P-value
Fig. 6
Fig. 6
Comprehensive assessment of Mendelian randomization analysis. A, B Forest plots of different exposure factors and outcome variables; C Scatter plot of genetic variant effects, with different colored lines representing regression results from various MR methods; D Funnel plot for assessing horizontal pleiotropy and heterogeneity. This comprehensive analysis validates the robustness and reliability of causal inference

Similar articles

References

    1. Bianchi G, Vogt B, Bargagli M, Ferrier C. The dilemma of chronic kidney disease and end-stage kidney disease following pre-eclampsia: a literature review and meta-analysis. Int Urol Nephrol. 2025. - PubMed
    1. Kofod DH, Carlson N, Almdal TP, Bomholt T, Torp-Pedersen C, Norgaard K, Svendsen JH, Feldt-Rasmussen B, Hornum M. The association between hemoglobin A1c and complications among individuals with diabetes and severe chronic kidney disease. Diabetes Care. 2025;48(8):1400-1409. - PMC - PubMed
    1. Kou J, Wei T, Liu H, Sun L, Ding D, Song S. Temporal trends in cross-country inequalities of chronic kidney disease attributable to temperature exposure from 1990 to 2021. Int Urol Nephrol. 2025. - PubMed
    1. Ansari Z, Chaurasia A, Neha, Sharma N, Bachheti RK, Gupta PC. Exploring inflammatory and fibrotic mechanisms driving diabetic nephropathy progression. Cytokine Growth Factor Rev. 2025. - PubMed
    1. Wang N, Li X, Weng H, Zhang Y, Li Q, Luo X, Chen Y, Dong Y. A bibliometric study of global trends in diabetic nephropathy and intestinal flora research. Front Microbiol. 2025;16:1577703. - PMC - PubMed

LinkOut - more resources