. 2025 Aug 8;13(1):81.
doi: 10.1186/s40635-025-00794-0.

The focal index: a quantitative approach to morphological sub-phenotyping of COVID-19 patients with acute respiratory distress syndrome: a pilot study

Affiliations

The focal index: a quantitative approach to morphological sub-phenotyping of COVID-19 patients with acute respiratory distress syndrome: a pilot study

Kristin Jona Bjarnadottir et al. Intensive Care Med Exp. .

Abstract

Background: Acute respiratory distress syndrome (ARDS) is characterised by significant morphological heterogeneity. Morphological sub-phenotyping can potentially be used to personalise mechanical ventilation. Current methods to classify lung injury as focal or diffuse rely on subjective image interpretation, which risks misclassification and suboptimal treatment. This study aimed to investigate the morphological appearance features of lung injury objectively. The focal index, an objective quantitative tool, was introduced to assess focality in lung injury.

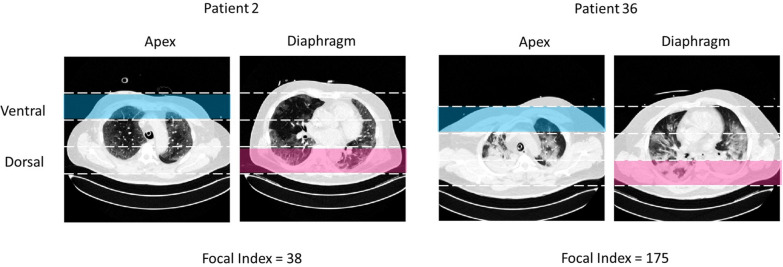
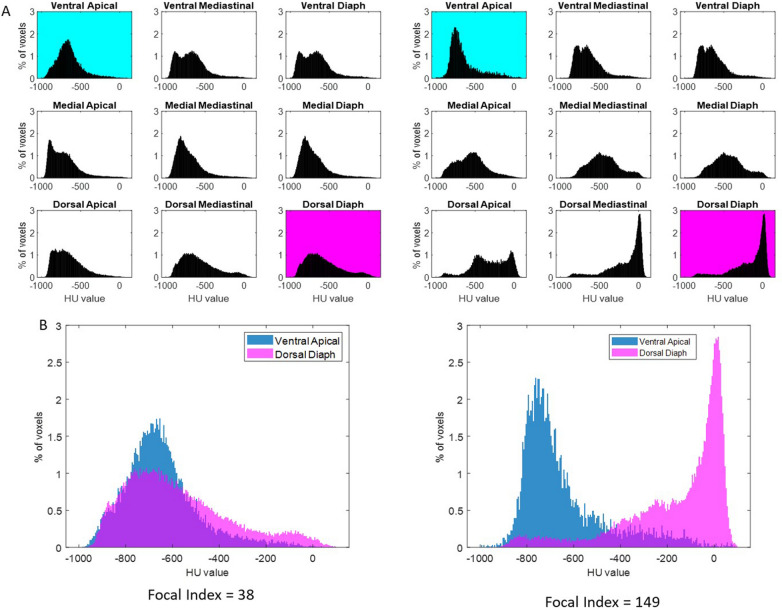
Methods: In this single-centre retrospective study, we included lung computed tomography (CT) scans from COVID-19 ARDS patients on invasive mechanical ventilation, classified as diffuse lung injury. CT data were analysed to extract regional Hounsfield Unit (HU) profiles across nine predefined lung areas. The focal index was derived by quantifying the non-overlapping area under HU distribution curves between the apical ventral and diaphragmatic dorsal regions. Correlations with lung weight, gas volume, and ventilatory settings were assessed. For validation, at least two experienced ICU consultants assessed the same images and determined whether ARDS was of a diffuse or focal type. The experts classified 36 out of 37 patients as diffuse ARDS, with substantial interobserver agreement (k = 0.65, 95% CI 0.02-1.00).

Results: The focal index demonstrated a wide range (25-175; mean 95.5 ± standard deviation 42.8), correlating significantly with the dorsal diaphragmatic non-aerated area (r = 0.67, p < 0.01) and with total gas volume (r = - 0.36, p = 0.03). There was no significant influence of ventilatory settings on the focal index.

Conclusions: The analysis suggested diffuse lung injury includes a spectrum of focality rather than a binary classification. The focal index provides an objective method to quantify the focality of lung injury in ARDS. Further studies are needed to validate the focal index across diverse ARDS aetiologies and establish its clinical application threshold for guiding personalised ventilation strategies.

Keywords: Acute respiratory distress syndrome; Lung imaging; Mechanical ventilation; Sub-phenotypes.


Conflict of interest statement

Declarations. Ethics approval and consent to participate: The Swedish National Ethical Review Authority (Dnr 2024-03697-01) approved this study. Consent for publication: Not applicable. Competing interests: All authors disclose any financial and personal conflicts of interest. MP serves on the Editorial Board for Intensive Care Medicine Experimental.

Figures

Fig. 1
Fig. 1
Schematic illustration of the examined lung area divided into nine defined regions. A. Anterioposterior division with apical (blue), mediastinal (purple) and diaphragmatic (pink) regions. B. Craniocaudal division with ventral (blue), medial (purple) and dorsal (pink) regions
Fig. 2
Fig. 2
Representative examples of CT scans from the 2 lung regions used to calculate the focal index. Two patients with extreme focal index values are reported. The ventral apical and the dorsal diaphragmatic areas are noted in blue and pink, respectively
Fig. 3
Fig. 3
Focal index in the patients’ cohort. Histogram reporting the Focal CT score for the 36 patients included in the analysis. The focal index was calculated as the absolute difference between the areas under the curve for the HU distribution profile of the (Ventral Apical ROI) and the (Dorsal Diaphragmatic ROI)
Fig. 4
Fig. 4
Regional HU distribution and focal index calculation in two representative patients. Two patients with two extreme values of the Focal index are reported. A. Regional HU distribution profiles for the nine defined three-dimensional regions of interest (ROI, i.e., Ventral Apical, Ventral Mediastinal, Ventral Diaphragmatic, Medial Apical, Medial Mediastinal, Medial Diaphragmatic, Dorsal Apical, Dorsal Mediastinal, Dorsal Diaphragmatic). The Y-axis reports the percentage of total voxels in that specific ROI, and the X-axis reports the HU values divided into 5 HU-wide bins. Histograms of HU distribution for each of the nine predefined lung regions in two patients: one with a low focal index (left, FI = 38) and one with a high focal index (right, FI = 149). The ventral apical (cyan) and dorsal diaphragmatic (magenta) regions are highlighted, as they are used for the focal index calculation. B. Superimposed HU distribution curves for the ventral apical and dorsal diaphragmatic regions. The focal index is calculated as the non-overlapping area between the HU distribution curves of the ventral apical and dorsal diaphragmatic regions of interest (ROIs). Each curve is normalised to an area of 100, and the focal index is computed as the integral of the absolute difference between the two curves across the full HU range (− 1000 to + 100). The resulting value is scaled by a factor of 100, yielding a score that ranges from 0 (complete overlap) to 200 (complete separation), reflecting the degree of morphological focality. The patient on the left shows substantial overlap between the two distributions, indicating low regional heterogeneity and a more uniform (diffuse) injury. In contrast, the patient on the right shows clear separation between the two regional HU profiles, reflecting pronounced dorsal consolidation and ventral preservation, consistent with a more focal pattern of injury despite expert classification as “diffuse”
Fig. 5
Fig. 5
Pearson’s correlation to investigate the relationship between the focal index and: (1) total gas (left) and (2) lung weight (right)
Fig. 6
Fig. 6
Sensitivity analysis testing the influence of ventilatory variables on the focal index. The three independent variables tested were (1) tidal volume per predicted body weight (Vt/PBW, ml/kg), (2) respiratory rate (RR, breaths/minute), and (3) positive end-expiratory pressure (PEEP, cmH2O). The multiple linear regression model tested their effect on the focal index, showing the absence of any significant influence

Similar articles

References

    1. Bos LD, Artigas A, Constantin J-M et al (2021) Precision medicine in acute respiratory distress syndrome: workshop report and recommendations for future research. Eur Respir Rev 30:200317. 10.1183/16000617.0317-2020 - PMC - PubMed
    1. Pellegrini M, Del Sorbo L, Ranieri VM (2024) Finding the optimal tidal volume in acute respiratory distress syndrome. Intensive Care Med 50:1154–1156. 10.1007/s00134-024-07440-5 - PMC - PubMed
    1. Bellani G, Laffey JG, Pham T et al (2016) Epidemiology, patterns of care, and mortality for patients with acute respiratory distress syndrome in intensive care units in 50 countries. JAMA 315:788–800. 10.1001/jama.2016.0291 - PubMed
    1. Sinha P, Calfee CS (2019) Phenotypes in acute respiratory distress syndrome: moving towards precision medicine. Curr Opin Crit Care 25:12. 10.1097/MCC.0000000000000571 - PMC - PubMed
    1. Bos LDJ, Ware LB (2022) Acute respiratory distress syndrome: causes, pathophysiology, and phenotypes. Lancet 400:1145–1156. 10.1016/S0140-6736(22)01485-4 - PubMed

LinkOut - more resources