. 2025 Nov 3;85(21):4182-4197.
doi: 10.1158/0008-5472.CAN-24-1986.

Caloric Restriction Enhances the Efficacy of Antiandrogen Therapy in Prostate Cancer by Inhibiting Androgen Receptor Translation

Affiliations

Caloric Restriction Enhances the Efficacy of Antiandrogen Therapy in Prostate Cancer by Inhibiting Androgen Receptor Translation

Ricardo A Cordova et al. Cancer Res. .

Abstract

Epidemiologic studies suggest that diet can affect the incidence, progression, and response to treatment in multiple cancers, including prostate cancer. In this study, we investigated the use of dietary interventions, specifically caloric or protein restriction, in combination with antiandrogen therapy as a treatment for prostate cancer. Caloric restriction through alternate-day fasting (ADF) reduced androgen receptor (AR) expression and signaling. This reduction in AR enhanced the antitumor activity of the AR antagonist enzalutamide in multiple mouse models of prostate cancer. Mechanistic studies revealed that nutrient starvation via ADF predominantly decreased AR mRNA translation at the elongation stage due to AA limitation. Pharmacologic agents that similarly impair translation elongation and promote ribosome collisions mimicked the AR translation reduction observed with ADF. Overall, these findings suggest that AA limitation through ADF impairs translation elongation in prostate cancer, to which AR mRNA translation is susceptible, leading to a reduction in AR protein levels and enhancing AR-targeted therapy.

Significance: Fasting-induced caloric restriction reduces androgen receptor translation and enhances the activity of enzalutamide, suggesting that dietary intervention could be an effective strategy to enhance prostate cancer sensitivity to antiandrogen therapy. See related commentary by Anzules et al., p. 4045.


Conflict of interest statement

Conflict of Interest

The other authors declare no potential conflicts of interest.

Figures

Figure 1.
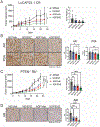
Figure 1.. Caloric restriction via ADF, and not dietary protein restriction, decreases AR expression and signaling in the LuCaP23.1 CR PCa PDX model.
A, Tumor volume of castrated mice bearing LuCaP23.1 CR tumors fed a ND or subjected to ADF. Statistical significance was determined using a two-way analysis of variance (ANOVA) with Sidak’s multiple comparisons (N = 7). Error bars indicate the standard error of the mean (SEM). Final tumor weights are represented in the bar graph. Statistical significance was determined using an unpaired two-tailed t-test. Error bars indicate standard deviation (SD). B, Body weights for mice bearing LuCaP23.1 CR tumors fed an ND or subjected to ADF. Error bars indicate SEM (N = 7). C, IHC staining for AR, PSA, or Ki-67 from LuCaP-23.1 CR tumors described above. D, IHC staining for AR, PSA, or Ki-67 from LuCaP-23.1 CR tumors from mice fed a ND or PR diet. The bar graphs in panels C and D show quantification of percent positive nuclear staining (AR and Ki-67) or Histoscore (PSA). Statistical significance was determined using an unpaired two-tailed t-test (N = 8). Error bars indicate SD. For all panels, *p≤0.05, and **p≤0.01.
Figure 2.
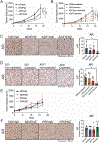
Figure 2.. ADF decreases AR expression and enhances ENZ anti-tumor activity in LuCaP23.1 CR and Pten−/− Rb−/− models of PCa.
A, Tumor volume of mice bearing LuCaP23.1 CR tumors fed a ND or subjected to ADF and treated with Veh, or ENZ. Two-way ANOVA with Sidak’s multiple comparisons (N = 4–7). Error bars indicate SEM. Final tumor weights are represented in the bar graphs (right panel). Two-way ANOVA with Sidak’s multiple comparisons. Error bars indicate SD (N = 4–7). B, IHC staining for AR and PSA from LuCaP-23.1 CR tumors from panel A. Bar graphs show quantification of percent positive nuclear staining for AR and the histoscore for PSA. One-way ANOVA with Tukey’s multiple comparisons (N = 6–8). Error bars indicate SD. C, Tumor volumes of mice bearing Pten−/− Rb−/− tumors treated as described in panel A. Two-way ANOVA with Sidak’s multiple comparisons (N = 5). Error bars indicate SEM. Tumor weights are represented in the bar graph. Unpaired two-tailed t-test (N = 5). Error bars indicate SD. D, IHC staining for AR from Pten−/− Rb−/− tumors from panel C. Bar graphs show quantification of percent positive nuclear staining for AR. Statistical significance was determined using a one-way ANOVA with Tukey’s multiple comparisons (N= 5–6). Error bars indicate SD. For all panels, *p ≤0.05, **p ≤ 0.01 ***p ≤ 0.001, and ****p ≤ 0.0001.
Figure 3.
Figure 3.. Enhanced anti-androgen activity and delayed tumor growth in B6MYC-CaP model treated with ADF in combination with ENZ or surgical castration.
A, Tumor volume of mice bearing B6MyC-CaP tumors fed a ND or subjected to ADF and treated with Veh, or ENZ. Statistical significance was determined using a two-way ANOVA with Sidak’s multiple comparisons (N = 9–10). Error bars indicate SEM. B, Tumor volume of castrated or non-castrated mice bearing B6MyC-CaP tumors fed a ND or subjected to ADF. Statistical significance was determined using a two-way ANOVA with Sidak’s multiple comparisons (N = 6–8). Error bars indicate SEM. C-D, IHC staining for AR in B6-MyC-CaP tumors from panel A (N = 9) and panel B (N = 6–8). Bar graphs show the quantification of percent positive nuclear staining for AR. Statistical significance was determined using a one-way ANOVA with Tukey’s multiple comparisons. Error bars indicate SD. E, Tumor volume of mice bearing B6MyC-CaP tumors fed a ND or a PR diet and treated with Veh, or ENZ. Statistical significance was determined using a two-way ANOVA with Sidak’s multiple comparisons (N = 9). Error bars indicate SEM. F, IHC staining for AR from B6MyC-CaP tumors from panel E. Bar graphs show quantification of percent positive nuclear staining for AR (N = 9). Statistical significance was determined using a one-way ANOVA with Tukey’s multiple comparisons. Error bars indicate SD. For all panels, *p ≤0.05, **p ≤ 0.01 ***p ≤ 0.001, and ****p ≤ 0.0001.
Figure 4.
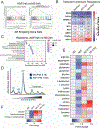
Figure 4.. ADF diet lowers AR signaling, global translation, and select metabolites in B6MYC-CaP tumors.
A, AR signaling gene sets from GSEA comparing animals bearing B6MycC-CaP tumors on an ADF diet versus a ND. B, IPA upstream regulator analysis from the transcriptome analyses (−log10 fdr > 1.3) (Supplementary File 3). The heat map indicates Z-scores of predicted upstream regulators, with the index showing the scale for activation Z score. The Z score for each indicated group was computed in comparison to the ND/Veh control group. C, Top enriched and depleted gene sets from the Reactome database analyses were determined using GSEA, comparing treatment groups described in panel A (Supplementary File 1). D, Polysome analysis of B6MyC-CaP tumors from mice fed a ND or ADF diet. Free 40S and 60S ribosomes, 80S monosomes, and polysomes are indicated above the profiles. The polysome to monosome ratio (P/M) is shown for both treatment groups. E, Amino acids, F, glucose, hexose-phosphate, and fructose-1,6-bisphosphate measurements from B6MyC-CaP tumors fed a ND, ADF diet, a control diet (21% protein), or a PR diet (7% protein). Results are shown as fold change relative to ND diet (N = 4–5). Supplementary File 1 includes metabolite measurements and statistical significance.
Figure 5.
Figure 5.. Lowered AR protein levels during nutrient starvation is mediated by amino acid limitations.
A, Immunoblot analysis of B6MyC-CaP cells cultured in complete media, low glucose (1g/L) media, low AA (20% AAs), or low glucose and 20% AA for 4 hours. Bar graphs for the relative levels of indicated proteins normalized to actin. Statistical significance was determined using a one-way ANOVA with Tukey’s multiple comparisons (N=3). B, Immunoblot analysis of B6MyC-CaP cells were cultured in complete DMEM media or media containing low glucose and the indicated percentages of AAs. C. B6MyC-CaP cells were cultured in complete DMEM media or DMEM media containing low glucose (1g/L) and 20% AA for 4 and 8 hours, and the indicated mRNAs were measured by qRT-PCR. Statistical significance was determined using a one-way ANOVA with Tukey’s multiple comparisons (N = 4). D, AR activity was measured using an AR luciferase activity reporter in B6MyC-CaP cells cultured in complete media (Control) or media with low glucose and 20% AAs (-AA -Gluc) and treated with the indicated concentrations of ENZ for 24 hours. Statistical significance was determined using a two-way ANOVA with Sidak’s multiple comparisons (N = 3). All error bars indicate SD. For all panels, *p ≤0.05, **p ≤ 0.01 ***p ≤ 0.001, and ****p ≤ 0.0001.
Figure 6.
Figure 6.. Nutrient depletion lowers AR mRNA translation.
A, Immunoblot analysis of B6MyC-CaP cells cultured in complete media or media containing low glucose and 20% AAs for 4 – 24 hours. Global protein synthesis was measured by puromycin incorporation. The right panels show bar graphs with the relative levels of the indicated protein normalized to actin. Statistical significance was determined using a one-way ANOVA with Tukey’s multiple comparisons (N = 3). B, B6MyC-CaP cells were cultured as described in panel A for 2 hours, labeled with [35S]methionine, and immunoprecipitated using an AR-specific antibody (IP: AR). The incorporation of [35S]methionine into AR and total protein was detected by autoradiography. Immunoblot analyses were used to measure total AR protein and actin. The bar graphs show the relative levels of [35S]methionine-labeled AR or total protein normalized to levels of proteins stained with Coomassie. Unpaired two-tailed t-test (N = 3). C, B6MyC-CaP cells were cultured in complete media (Control) or media containing low glucose and AA (-AA -Gluc) for 2 hours, followed by treatment with 2 μg/ml cycloheximide starting at 0 minutes. AR protein levels were measured by immunoblotting. Statistical significance was determined using a two-way ANOVA with Sidak’s multiple comparisons (N = 3). All error bars indicate SD. For all panels, **p ≤ 0.01, ***p ≤ 0.001, and ****p ≤ 0.0001
Figure 7.
Figure 7.. The elongation phase of AR mRNA translation is impeded during nutrient limitations.
A, Immunoblot analysis of B6MyC-CaP cells cultured in complete media or in media containing low glucose and 20% AAs for up to 24 hours. The bar graphs show the relative levels of the indicated phosphorylated proteins normalized to the amounts of total protein. Statistical significance was determined using a one-way ANOVA with Tukey’s multiple comparisons (N = 3), *p ≤0.05, **p ≤ 0.01, ****p ≤ 0.0001. B, Immunoblot analysis of B6MyC-CaP cells cultured in complete media (100% AA) or DMEM media containing low glucose and different percentages of AAs and treated with or without GCN2iB (2 µM) for 4 hours. To measure bulk protein synthesis, puromycin was added to the cultures for 15 minutes prior to lysate preparation. C, D, Polysome profiles of B6MyC-CaP cells cultured in complete DMEM media, or DMEM media containing low glucose and 20% AAs for 4 hours. The polysome-to-monosome ratio (P/M) is shown for both treatment groups. For panel D, cells were treated with 2 µg/ml harringtonine (HT) for 3 minutes before cell lysate preparation. The total transcript level for AR mRNA in each fraction is shown in the bar graphs and the percentage shift was calculated. Error bars indicate SD. E, Immunoblot analysis of B6MyC-CaP cells cultured in complete media (Control), media containing low glucose (-Gluc), and different percentages of AAs as indicated, 100 nM GCN2iB, or 100 nM halofuginone (HF) for 4 hours. The relative level of each of the indicated proteins compared to control is shown below each blot.

References

    1. Siegel RL, Miller KD, Jemal A. Cancer statistics, 2019. CA Cancer J Clin 2019;69:7–34 - PubMed
    1. Kantor ED, Haneuse S, Valdimarsdottir UA, Williams DR, Signorello LB, Rider JR. Socioenvironmental adversity and risk of prostate cancer in non-Hispanic black and white men. Cancer Causes Control 2019;30:997–1007 - PMC - PubMed
    1. Watson PA, Arora VK, Sawyers CL. Emerging mechanisms of resistance to androgen receptor inhibitors in prostate cancer. Nat Rev Cancer 2015;15:701–11 - PMC - PubMed
    1. Katzenwadel A, Wolf P. Androgen deprivation of prostate cancer: Leading to a therapeutic dead end. Cancer Lett 2015;367:12–7 - PubMed
    1. Taylor SR, Falcone JN, Cantley LC, Goncalves MD. Developing dietary interventions as therapy for cancer. Nat Rev Cancer 2022;22:452–66 - PMC - PubMed

MeSH terms