. 2025 Aug 8;10(15):e191090.
doi: 10.1172/jci.insight.191090.

A prometabolite strategy inhibits cardiometabolic disease in an ApoE-/- murine model of atherosclerosis

Affiliations

A prometabolite strategy inhibits cardiometabolic disease in an ApoE-/- murine model of atherosclerosis

Taryn N Beckman et al. JCI Insight. .

Abstract

Butyrate, a microbiome-derived short-chain fatty acid with pleiotropic effects on inflammation and metabolism, has been shown to significantly reduce atherosclerotic lesions, rectify routine metabolic parameters such as low-density lipoprotein cholesterol (LDL-C), and reduce systemic inflammation in murine models of atherosclerosis. However, its foul odor, rapid metabolism in the gut and thus low systemic bioavailability limit its therapeutic effectiveness. Our laboratory has engineered an ester-linked L-serine conjugate to butyrate (SerBut) to mask its taste and odor and to coopt amino acid transporters in the gut to increase its systemic bioavailability, as determined by tissue measurements of free butyrate, produced by hydrolysis of SerBut. In an apolipoprotein E-knockout (ApoE)-/- mouse model of atherosclerosis, SerBut reduced systemic LDL-C, proinflammatory cytokines, and circulating neutrophils. SerBut enhanced inhibition of plaque progression and reduced monocyte accumulation in the aorta compared with sodium butyrate. SerBut suppressed liver injury biomarkers alanine transaminase and aspartate aminotransferase and suppressed steatosis in the liver. SerBut overcomes several barriers to the translation of butyrate and shows superior promise in slowing atherosclerosis and liver injury compared with equidosed sodium butyrate.

Keywords: Atherosclerosis; Inflammation; Obesity; Therapeutics; Transport.


Conflict of interest statement

Conflict of interest: SC, EB, and JAH are inventors on US patent US20240207213A1 filed by the University of Chicago on uses of SerBut.

Figures

Figure 1
Figure 1. SerBut reduces cytotoxicity as a carrier of inflammatory NF-κB pathway–suppressing butyrate in vitro.
(A) Viability of RAW 264.7 cells treated with 0.15, 0.44, 1.33, 4, and 12 mM SerBut or NaBut for 24 hours. (B) LC-MS/MS analysis of free butyrate in solution of aged SerBut (incubated at 37°C in FBS-supplemented media for 1 month) and freshly dissolved SerBut and NaBut. (C) NF-κB activity of RAW Blue reporter cells upon treatment with the indicated concentrations of SerBut or NaBut for 24 hours followed by stimulation with 200 ng/mL LPS for 6 hours. (DJ) RAW 264.7 cells treated for 24 hours with the indicated concentrations of SerBut or NaBut followed by stimulation with 200 ng/mL LPS for 6 hours. (DE) Mean fluorescence intensity (MFI) of iNOS+ or CD80+ RAW 264.7 cells analyzed by flow cytometry. (FJ) Cytokine concentrations in the cell culture supernatant of RAW 264.7 cells. “x” indicates untreated group. In A, n = 3 per group representing technical replicates. In B, n = 3 freshly prepared samples per 2 distinct experiments pooled for aged SerBut and NaBut groups, while fresh the SerBut group represents a single experiment. One sample in the aged SerBut group and 2 samples in the NaBut group were lost due to filtering malfunctions or LC-MS/MS autosampling malfunctions. In C, n = 6 technical replicates. Data represent mean ± SEM. Experiments were performed 2 or more times with similar results. In A, 2-way ANOVA was performed. Statistical analyses were performed using a 1-way ANOVA with Tukey’s, Welch’s (if standard deviations were significantly different by Bartlett and Brown-Forsyth tests), or Kruskal-Wallis (if data were not normally distributed determined by Shapiro-Wilk test) post hoc test in CJ. P values less than 0.10 are shown.
Figure 2
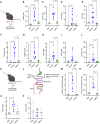
Figure 2. Seryl modification increases oral bioavailability of butyrate in atherosclerotic organs.
(A) Experimental schema of ApoE–/– mice fed an HFD for 8 weeks, after which they received a single equimolar gavage of 272 mM butyrate as SerBut or NaBut. After 3 hours, mice were perfused, and the amount of butyrate per gram of tissue was measured in the (B) heart, (C) aorta, (D) liver, (E) inguinal lymph nodes (ILNs), (F) kidney, (G) spleen, (H) lung, (I) mesenteric lymph nodes (MLNs), and (J) plasma (μM). n = 8 mice in SerBut and NaBut groups. n = 6 mice in PBS group. (K) Experimental schema of C57BL/6 mice fed a normal chow (NC) diet, after which they received a single equimolar gavage of 272 mM butyrate as SerBut or NaBut. (L) Diagram of gut dissection. (M) Upper small intestine. (N) Lower small intestine. (O) Ileum. (P) Colon. Quantification was performed by LC-MS/MS upon derivatization with 3-nitrophenylhydrazine. Free butyrate (g) was normalized to tissue weight (g). Data points represent individual mice displayed with median ± SEM. Statistical analyses were performed using a 1-way ANOVA with Tukey’s, Welch’s (if SDs were significantly different by Bartlett and Brown-Forsyth tests), or Kruskal-Wallis (if data were not normally distributed determined by Shapiro-Wilk test) post hoc test. P values less than 0.10 are shown.
Figure 3
Figure 3. SerBut suppresses the progression of atherosclerotic plaque, accumulation of immune cells in the aorta, and systemic inflammation.
(A) Schema of female ApoE–/– mice on an HFD with 150 mM SerBut or NaBut on a butyrate basis, or water ad libitum for 6 weeks. (B) Oil Red O (ORO) staining of aortic root plaque. (C) CD68+ IHC staining of aortic root plaque. Original magnification, ×20. (D) Representative images of immunofluorescent staining of aortic root. (E) Quantification of ORO+ aortic root valve area. (F) Histological Stary scoring of plaque severity, (G) quantified CD68+ area, and (H) necrotic core of CD68+ IHC staining. (I) Quantified DAPI+, (J) DAPI+ per plaque area, (K) iNOS+, and (L) iNOS+ cells per plaque area in immunofluorescence stain. (MO) Flow cytometry of immune cells infiltrating the aorta: (M) CD45+ total leukocytes, (N) CD11b+ monocytes, and (O) CCR2+CD11b+ monocytes. (P) Water consumed by cages for the first 19 days of experiment. Data represent mean water consumed between 2 cages (replicates) as weight change of bottle converted to water volume. Error bars represent SD. (Q) Plasma IL-6 and (R) IFN-γ. (S) Blood flow cytometry of Ly6G+CD11b+ circulating neutrophils. n = 5/cage and n = 10 mice per group. Data points represent individual mice displayed with median ± SEM. Statistical analyses were performed using a 1-way ANOVA with Tukey’s, Welch’s (if SDs were significantly different by Bartlett and Brown-Forsyth tests), or Kruskal-Wallis (if data were not normally distributed determined by Shapiro-Wilk test) post hoc test. P values less than 0.10 are shown. Outliers were removed by ROUT testing at Q = 1% in IL. Scoring in C was done blinded. Data in C and FH represent 2 independent pooled experiments: n = 10 for water and SerBut groups and n = 10 for NaBut groups in a single experiment. “B6,NC” denotes age-matched C57BL/6 mice on normal diet as non-statistical comparison to visualize healthy examples. Scale bars: 200 μm.
Figure 4
Figure 4. SerBut suppresses plasma LDL-C and reduces liver damage markers.
Plasma taken at 6 weeks of treatment in the regimen described in Figure 3A. (AD) Blood chemical analysis pooled between 2 duplicate studies: (A) Percentage LDL/total cholesterol, (B) percentage HDL/total cholesterol, (C) total cholesterol, and (D) triglycerides. (EG) Blood chemical analysis: (E) alanine transaminase (ALT), (F) aspartate aminotransferase (AST), and (G) lipase. P values less than 0.10 are shown. (H) Average weight of mice in water- and SerBut-treated groups. “B6,NC” denotes 3 age-matched C57BL/6 mice on a normal diet as a non-statistical comparison to visualize healthy examples. Data points represent individual mice displayed with median ± SEM. Data in AD represent 2 independent pooled experiments: n = 10 per group per experiment for water- and SerBut-treated groups; n = 10 in a single experiment for NaBut-treated group. Statistical analyses were performed using a 1-way ANOVA with Tukey’s, Welch’s (if SDs were significantly different by Bartlett and Brown-Forsyth tests), or Kruskal-Wallis (if data were not normally distributed determined by Shapiro-Wilk test) post hoc test. P values less than 0.10 are shown.
Figure 5
Figure 5. SerBut suppresses liver injury induced by HFD feeding.
Histology of livers taken after 6 weeks of treatment. (AE) Histological scoring of livers: (A) macrovesicular fat, (B) lobular inflammation, (C) nuclear hypertrophy, (D) overall score, and (EH) representative images of H&E staining in (E) NaBut, (F) Serbut, (G) water, or (H) B6,NC. “B6,NC” denotes 3 age-matched C57BL/6 mice on a normal diet as a non-statistical comparison. Scale bars: 20 μm (top row) and 100 μm (bottom 2 rows). (IL) Representative images of IHC-stained CD3+ immune cells in (I) NaBut, (J) SerBut, (K) water, (L) or age-matched WT controls. n = 10 per group in a single experiment for all groups. Kruskal-Wallis test for multiple comparisons was used. Score was calculated as the sum of scores displayed in AD graded by a pathologist. A and C were graded using H&E-stained slides. B was graded using IHC-stained slides for CD3+ immune cells. Representative images were chosen based on average score for a particular treatment group.

References

    1. Libby P. The changing landscape of atherosclerosis. Nature. 2021;592(7855):524–533. doi: 10.1038/s41586-021-03392-8. - DOI - PubMed
    1. Roy P, et al. How the immune system shapes atherosclerosis: roles of innate and adaptive immunity. Nat Rev Immunol. 2022;22(4):251–265. doi: 10.1038/s41577-021-00584-1. - DOI - PMC - PubMed
    1. Chatzizisis Yiannis S, et al. Role of endothelial shear stress in the natural history of coronary atherosclerosis and vascular remodeling: molecular, cellular, and vascular behavior. J Am Coll Cardiol. 2007;49(25):2379–2393. doi: 10.1016/j.jacc.2007.02.059. - DOI - PubMed
    1. Jain V, et al. Demographic and regional trends of cardiovascular diseases and diabetes mellitus-related mortality in the United States From 1999 to 2019. Am J Med. 2023;136(7):659–668. doi: 10.1016/j.amjmed.2023.03.002. - DOI - PubMed
    1. Averbukh LD, et al. Statin-induced liver injury patterns: a clinical review. J Clin Transl Hepatol. 2022;10(3):543–552. doi: 10.14218/JCTH.2021.00271. - DOI - PMC - PubMed