. 2025 Aug 8;20(8):e0329823.
doi: 10.1371/journal.pone.0329823. eCollection 2025.

Expression of human A53T alpha-synuclein without endogenous rat alpha-synuclein fails to elicit Parkinson's disease-related phenotypes in a novel humanized rat model

Affiliations

Expression of human A53T alpha-synuclein without endogenous rat alpha-synuclein fails to elicit Parkinson's disease-related phenotypes in a novel humanized rat model

Nicole K Polinski et al. PLoS One. .

Abstract

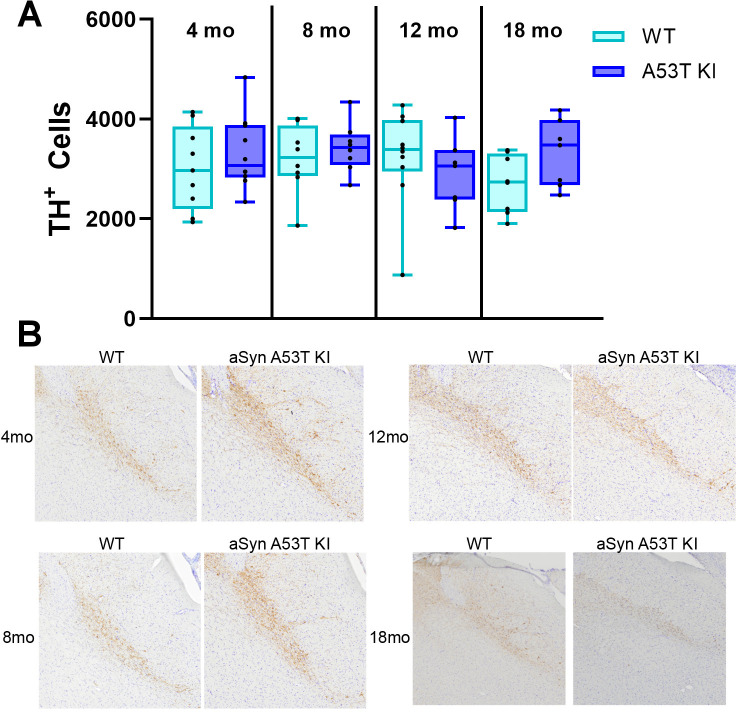
Alpha-synuclein (aSyn) is linked to Parkinson's disease (PD) through SNCA genetic mutations, phosphorylated aSyn in Lewy bodies and Lewy neurites, and most recently through evidence of aSyn aggregation in patient spinal fluid using the aSyn seed amplification assay. Therefore, understanding the biology of this protein and developing therapeutic interventions targeting pathological processing of aSyn are a key area of focus for novel treatments to slow or stop PD. Reliable preclinical models are imperative for these efforts. To this end, we developed a novel model using CRISPR/Cas9 to humanize the regions surrounding the naturally occurring threonine 53 amino acid in the Sprague Dawley rat to generate a humanized A53T aSyn rat model (aSyn A53T KI). We also generated an Snca knockout (aSyn KO) line to pair with the humanized A53T aSyn rat line to confirm that phenotypes were not due to loss of endogenous rat aSyn protein. A systematic phenotyping study was performed on these lines, assessing PD-related pathology and phenotypes at multiple timepoints. The aSyn KO rat line was profiled at 6 and 12 months of age, revealing successful aSyn protein knockout. The aSyn A53T KI model was profiled at 4, 8, 12, and 18 months of age for motor and non-motor phenotypes, nigrostriatal degeneration, and brain pathology. We confirmed the aSyn A53T KI rat expresses human aSyn while lacking endogenous rat aSyn. Motor function and non-motor function remain largely unaffected in this model, and no overt nigrostriatal degeneration or brain pathology are observed up to 18 months of age. Although the aSyn A53T KI rat lacks the ability to model PD pathology and phenotypes at baseline, it is an ideal model for investigating the impact of exogenous synuclein aggregates or environmental triggers on human aSyn in an in vivo model system.


Conflict of interest statement

The authors have declared that no competing interests exist.

Figures

Fig 1
Fig 1. The aSyn A53T KI rat line expresses A53T-mutated humanized SNCA gene without rat Snca in the brain.
Transcript levels (designated as median fluorescence intensity (MFI) of endogenous rat Snca and mutated humanized SNCA genes were quantified in the right brain hemisphere samples using the QuantiGene Plex assay and normalized to the geometric mean of mRNA expression levels of housekeeping genes Hmbs, Ppib, and Gapdh in the cortex (A, B), hippocampus (C, D), striatum (E, F), substantia nigra (G, H), and cerebellum (I, J). Data are presented as box-whisker plots. Data were analyzed using ordinary two-way ANOVA with genotype and age as independent factors. If the genotype × age effect was significant, pairwise comparisons within the same age group were done by the Holm–Šídák’s multiple comparisons test as follows: ***P < 0.001 ****P < 0.0001. If the factor interaction effect was not significant, main genotype effect was illustrated as follows: ####P < 0.0001.
Fig 2
Fig 2. Confirmation of successful rat Snca depletion in the aSyn KO rat line.
The QuantiGene Plex assay that utilized upstream and downstream probe sets for rat Snca showed specific signals (designated as Normalized MFI) only in samples from WT rats but not in samples from aSyn KO animals in the cortex (A), hippocampus (B), substantia nigra (C) and cerebellum (D). Data were analyzed using ordinary two-way ANOVA with genotype and age as independent factors. If the genotype × age effect was significant, pairwise comparisons within the same age group were done by the Holm–Šídák’s multiple comparisons test as follows: ****P < 0.0001. If the factor interaction effect was not significant, main genotype effect was illustrated as follows: ####P < 0.0001.
Fig 3
Fig 3. Confirmed loss of aSyn protein the aSyn KO line and expression of human aSyn protein in the aSyn A53T KI line.
(A) Relative expression of rat aSyn in the cortex of aSyn KO and associated WT rats. (B) Western blot image of total aSyn and actin western blot in cortex of aSyn KO and WT rats. (C) Relative expression of human aSyn in the cortex of aSyn A53T KI and associated WT rats. (D) Western blot image of total aSyn, triton-soluble aSyn, and triton-insoluble aSyn in cortex of aSyn A53T KI and WT rats. Horizontal bars indicate the median value. Data were analyzed using two-way repeated measures ANOVA with genotype and age as independent factors. Main genotype effect was illustrated as follows: #P < 0.05.
Fig 4
Fig 4. Gastrointestinal motility is generally unchanged in aSyn A53T KI rats.
(A, B) Stool counts in female and male aSyn A53T KI and WT rats of different ages. (C, D) Bead expulsion times in female and male aSyn A53T KI and WT rats of different ages. Data in A–D are presented as box-whisker plots. Data were analyzed using ordinary two-way ANOVA with genotype and age as independent factors (Stool count averaged over D1 and D2).
Fig 5
Fig 5. Open field locomotion is not robustly affected in aSyn A53T KI rats.
Open field measures of total distance travelled (A, B), distance travelled in the center (C, D), number of rearings (E, F), and velocity (G, H). Data are presented as the mean ± S.D (n = 3–15). Statistical analysis was conducted from sums of distances traveled during time bins except for velocity average of velocity during time bins was used. Data were analyzed using ordinary two-way ANOVA with genotype and age as independent factors.
Fig 6
Fig 6. Distance travelled in home cage by A53T KI and WT rats.
Distance travelled in home cage by female (A, C, E, G) and male (B, D, F, H) A53T KI and WT rats. Data are presented as the mean ± S.D. (n = 8–10 per each hourly point). Gray boxes indicate periods with lights switched off. For statistical analysis the distance travelled during the measurement period within age month were averaged and analyzed using ordinary two-way ANOVA.
Fig 7
Fig 7. Thigmotactic behavior in home cage of A53T KI and WT rats.
Thigmotactic behavior expressed as time spent near home cage walls in female (A, C, E, G) and male (B, D, F, H) A53T KI and WT rats. Data are presented as the mean ± S.D. (n = 8–10 per each hourly point). Gray boxes indicate periods with lights switched off. Averaged data were analyzed using ordinary two-way ANOVA with genotype and age as independent factors. If the genotype × age effect was significant, pairwise comparisons within the same age group were done by the Holm–Šídák’s multiple comparisons test as follows: *P < 0.05.
Fig 8
Fig 8. Beam walk test in A53T KI and WT rats reveals minor disturbances in front limbs in males only.
Ratio percentage of front limb slips (A, B) and hind limb slips (C, D) in female and male rats. L + R = left + right. Data are presented as box-whisker plots. Data were analyzed using ordinary two-way ANOVA with genotype and age as independent factors. If the genotype × age effect was significant, pairwise comparisons within the same age group were done by the Holm–Šídák’s multiple comparisons test as follows: *P < 0.05.
Fig 9
Fig 9. Kinematic analysis of fine motor skills in A53T KI and WT rats.
Gait overall score was calculated in 4-, 8-, 12-, and 18-month-old female (A) and male (B) rats as described previously [19]. Ordinary Two-way ANOVA results are indicated as follows: ##P < 0.01, main genotype effect; **P < 0.01, Holm–Šídák’s multiple comparisons test.
Fig 10
Fig 10. The humanized A53T aSyn KI and endogenous rat aSyn KO do not result in striatal neurochemistry deficits.
Striatal levels of dopamine (A, B), DOPAC (C, D), and HVA (E, F) were determined using HPLC in samples of 4- and 18-month-old aSyn A53T KI rats and 6- as well as 12-month-old aSyn KO rats and associated WT littermates. Data were analyzed using Mixed-effects model (REML) with genotype and age as independent factors. Results are indicated as follows: ***P < 0.001 age effect.
Fig 11
Fig 11. aSyn A53T KI do not display nigral neuron loss.
(A) Box-whisker plots of TH+ cell numbers in the SNpc of aSyn A53T KI and WT rats. (B) Images of midbrain sections stained for TH to visualize dopaminergic neurons in the SNpc.
Fig 12
Fig 12. aSyn A53T KI do not display aSyn pathology in the SNpc or gastrointestinal system.
(A-C) Representative images of staining for human/rat aSyn in the (A) midbrain, (B) colon, and (C) duodenum of WT and aSyn A53T KI rats. stained for human/rat aSyn. (D-F) Representative images of staining for pS129 aSyn in the (D) SNpc at 20x, (E) colon, and (F) duodenum. Colon and duodenum display high background fluorescence for pS129 aSyn.
Fig 13
Fig 13. aSyn A53T KI do not display tau pathology or neuroinflammation in brain.
(A) Representative images of staining for pS202/T205 tau in the cortex of WT and aSyn A53T KI mice. (B) Representative images of staining for Iba1-positive microglia in the SNpc at 10x and 20x magnification. (C) Representative images of GFAP-positive astrocytes in the brain.

Similar articles

References

    1. Dorsey ER, Sherer T, Okun MS, Bloem BR. The Emerging Evidence of the Parkinson Pandemic. J Parkinsons Dis. 2018;8(s1):S3–8. doi: 10.3233/JPD-181474 - DOI - PMC - PubMed
    1. Polymeropoulos MH, Lavedan C, Leroy E, Ide SE, Dehejia A, Dutra A, et al. Mutation in the alpha-synuclein gene identified in families with Parkinson’s disease. Science. 1997;276(5321):2045–7. doi: 10.1126/science.276.5321.2045 - DOI - PubMed
    1. Krüger R, Kuhn W, Müller T, Woitalla D, Graeber M, Kösel S, et al. AlaSOPro mutation in the gene encoding α-synuclein in Parkinson’s disease. Nat Genet. 1998;18(2):106–8. doi: 10.1038/ng0298-106 - DOI - PubMed
    1. Singleton AB, Farrer M, Johnson J, Singleton A, Hague S, Kachergus J, et al. alpha-Synuclein locus triplication causes Parkinson’s disease. Science. 2003;302(5646):841. doi: 10.1126/science.1090278 - DOI - PubMed
    1. Chartier-Harlin M-C, Kachergus J, Roumier C, Mouroux V, Douay X, Lincoln S, et al. Alpha-synuclein locus duplication as a cause of familial Parkinson’s disease. Lancet. 2004;364(9440):1167–9. doi: 10.1016/S0140-6736(04)17103-1 - DOI - PubMed