. 2025 Aug 8;20(8):e0327386.
doi: 10.1371/journal.pone.0327386. eCollection 2025.

In Silico identification and modelling of FDA-approved drugs targeting T-type calcium channels

Affiliations

In Silico identification and modelling of FDA-approved drugs targeting T-type calcium channels

Pedro Fong et al. PLoS One. .

Abstract

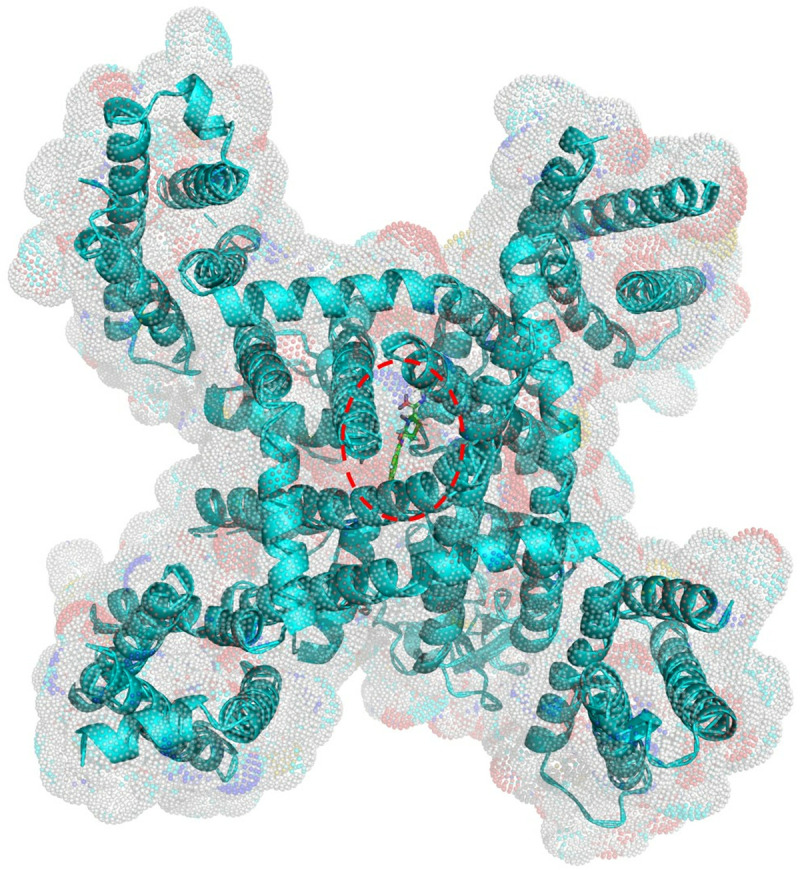
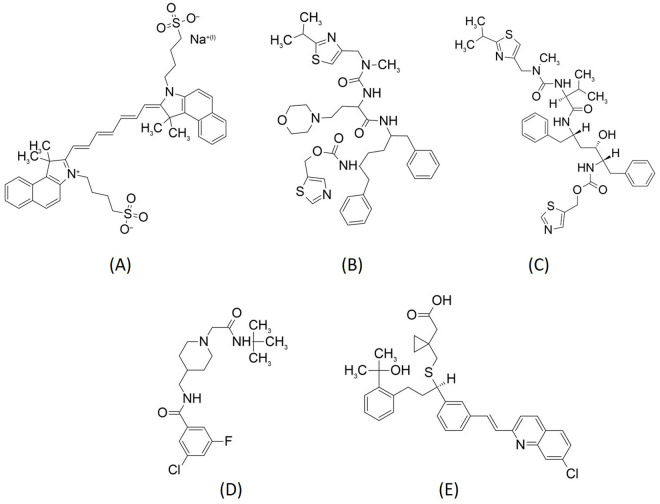
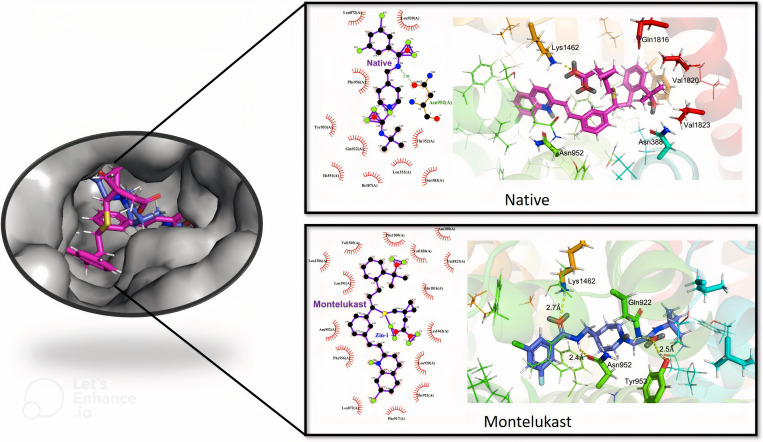
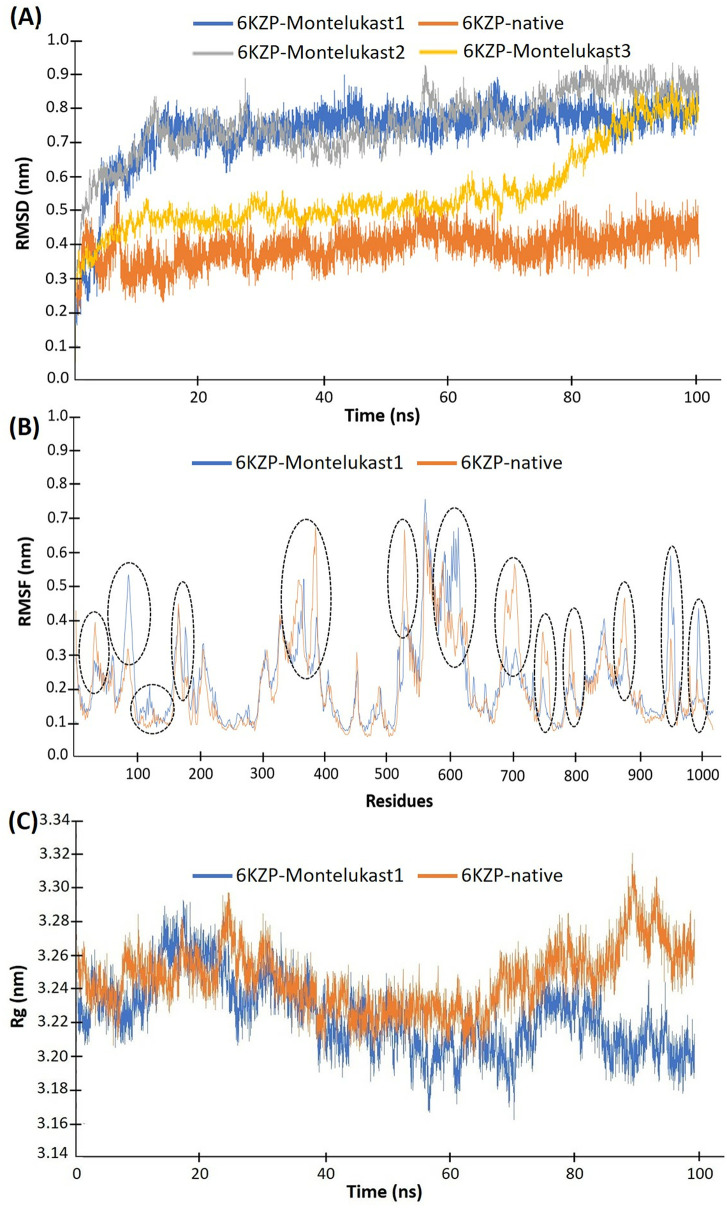
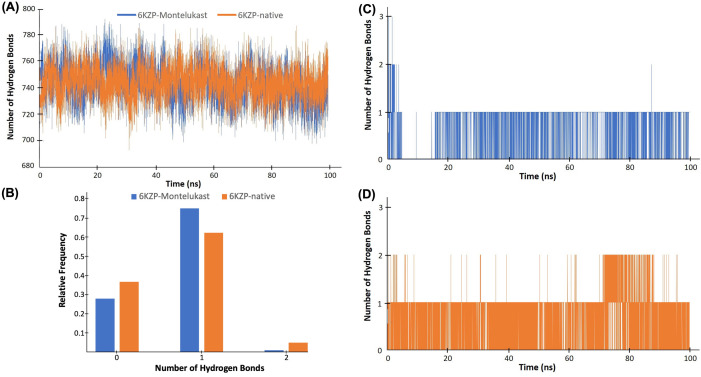
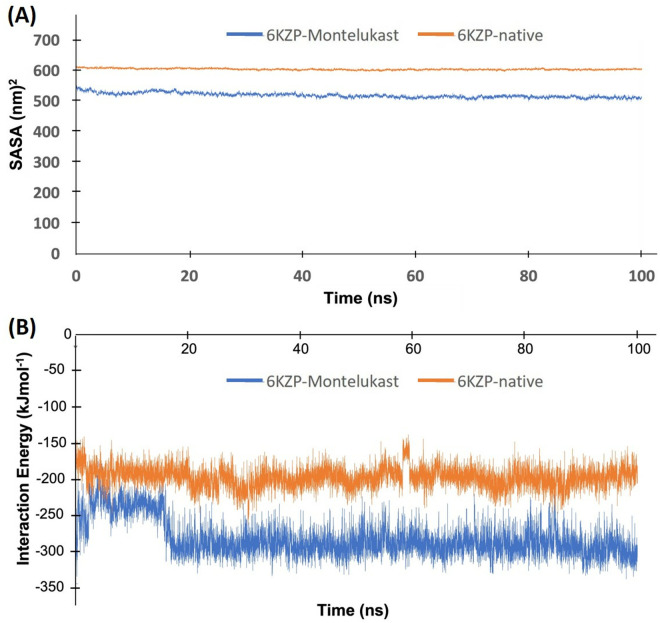
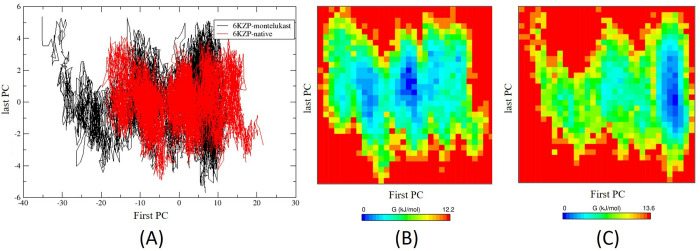
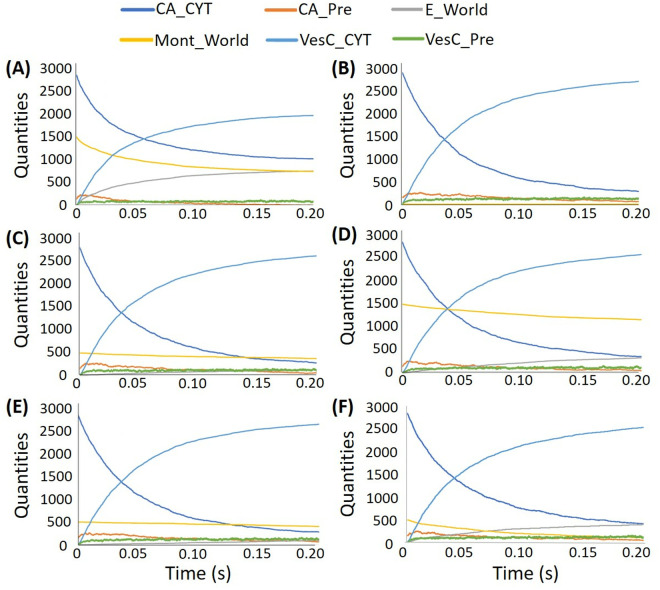
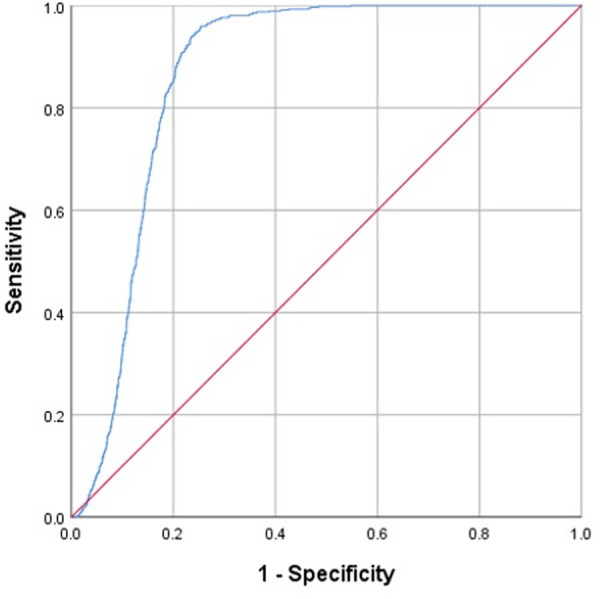
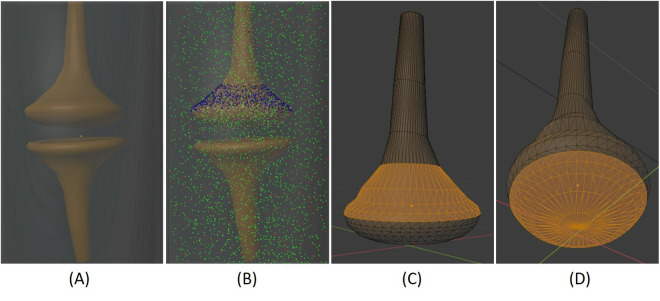
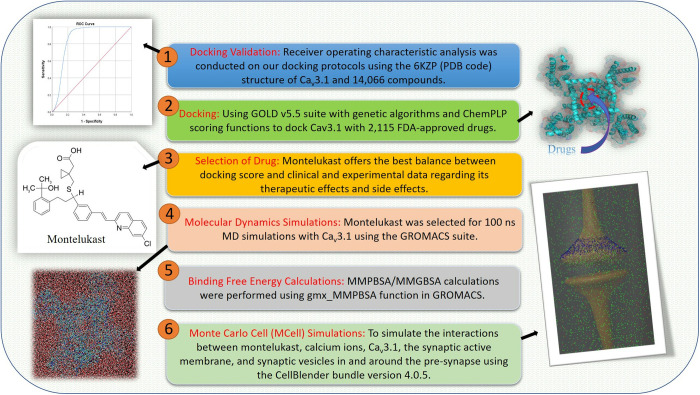
Studies have shown that inhibition of the Cav3.1 T-type calcium channel can prevent or suppress neurological diseases, such as epileptic seizures and diabetic neuropathy. In this study, we aimed to use in silico simulations to identify a U.S. Food and Drug Administration (FDA)-approved drug that can bind to the Cav3.1 T-type calcium channel. We used the automated docking suite GOLD v5.5 with the genetic algorithm to simulate molecular docking and predict the protein-ligand binding modes, and the ChemPLP empirical scoring function to estimate the binding affinities of 2,115 FDA-approved drugs to the human Cav3.1 channel. Drugs with high binding affinity and appropriate pharmacodynamic and pharmacokinetic properties were selected for molecular mechanics Poisson-Boltzmann surface area (MMPBSA) and molecular mechanics generalised Born surface area (MMGBSA) binding free energy calculations, GROMACS molecular dynamics (MD) simulations and Monte Carlo Cell (MCell) simulations. The docking results indicated that the FDA-approved drug montelukast has a high binding affinity to Cav3.1, and data from the literature suggested that montelukast has the appropriate drug-like properties to cross the human blood-brain barrier and reach synapses in the central nervous system. MMPBSA, MMGBSA, and MD simulations showed the high stability of the montelukast-Cav3.1 complex. MCell simulations indicated that the blockage of Cav3.1 by montelukast reduced the number of synaptic vesicles being released from the pre-synaptic region to the synaptic cleft, which may reduce the probability and amplitude of postsynaptic potentials.


Conflict of interest statement

The authors have declared that no competing interests exist.

Figures

Fig 1
Fig 1. Surface and cartoon view of the native ligand (Z944) in the human Cav3.1 (PDB: 6KZP).
The binding site is indicated by the red dotted line.
Fig 2
Fig 2. Chemical structures of (A) indocyanine green, (B) cobicistat, (C) ritonavir, (D) native ligand (PDB: 6KZP) and (E) montelukast.
Fig 3
Fig 3. 2D and 3D illustration of the docked structures between human Cav3.1 (PDB: 6KZP) and native ligand and montelukast, generated by Pymol and LigPlot + .
The annotated yellow dotted lines indicate the distance between the atoms, measured in angstroms. The green dotted lines represent hydrogen bonding. The red spoked arcs indicate the residues making hydrophobic contacts with the ligand.
Fig 4
Fig 4. (A) RMSD, (B) RMSF, and (C) Rg of the 6KZP-native complex (in orange) and the 6KZP-montelukast complex (in blue, grey, and orange).
Three 100 ns MD simulations were conducted on the 6KZP-montelukast complex, with labels 1, 2, and 3 indicating the 1st, 2nd, and 3rd simulations, respectively. The black dotted lines mark the regions with differing RMSF values between the 6KZP-native and 6KZP-montelukast complexes.
Fig 5
Fig 5. (A) Number of intra-hydrogen bonds for the 6KZP-native complex (orange colour) and 6KZP-montelukast complex (blue).
(B) The frequency of the number of inter-hydrogen bonds of the 6KZP-montelukast complex (blue) and 6KZP-native complex (orange colour). (C) Number of inter-hydrogen bonds for the 6KZP-montelukast complex. (D) Number of inter-hydrogen bonds for the 6KZP-native complex.
Fig 6
Fig 6. (A) SASA and (B) interaction energies of the 6KZP-native complex (orange colour) and 6KZP-montelukast complex (blue).
Fig 7
Fig 7. (A) Principal component analysis of the 2D projections of trajectories for the 6KZP-native complex and the 6KZP-montelukast complex.
Two-dimensional contour map of the Gibbs Free Energy Landscape (FEL) during 100 ns MD simulations for (B) the 6KZP-native complex and (C) the 6KZP-montelukast complex. The first and last principal components (PCs) indicate the components used to capture approximately 80% of the total dynamic motion. The 6KZP-montelukast complex requires 8 PCs, while the 6KZP-native complex requires 12 PCs.
Fig 8
Fig 8. Quantities of the items in the MCell simulations with standard parameters and: (A) 1,500 montelukast molecules and k2 = 1.0 × 108 M-1s-1; (B) no montelukast molecules and k2 = 1.0 × 108 M-1s-1; (C) 500 montelukast molecules and k2 = 1.0 × 107 M-1s-1; (D) 1,500 montelukast molecules and k2 = 1.0 × 107 M-1s-1; (E) 500 montelukast molecules and k2 = 0.5 × 106 M-1s-1; (F) 500 montelukast molecules and k2 = 1.0 × 108 M-1s-1.
CA_CYT and CA_Pre are the calcium ions located in the extra-synaptic region and the pre-synapse, respectively. E_World is the complex of montelukast and calcium channels. Mont_World is the montelukast in the whole system, VesC_CYT and VesC_Pre are the complexes of calcium ions and vesicles located in the extra-synaptic region and the pre-synapse, respectively.
Fig 9
Fig 9. Receiver operating characteristic curves of our docking simulations between Cav3.1 (PDB code 6KZP) and the 14,614 compounds obtained from the ZIV database and the ZINC database.
The red line is a reference line, which indicates no predictive power, and the blue line is the resulting curve with an AUC value of 0.865.
Fig 10
Fig 10. Model of synapse.
(A) The pre-synapse (top) and post-synapse (bottom); (B) The synapse model with calcium ions (green), montelukast (red), calcium channels (blue) and calcium pump (black); (C) The pre-synapse region (orange) where the calcium channels were located; (D) The pre-synapse region (orange) of the active membrane where the vesicle and calcium ion complexes were released.
Fig 11
Fig 11. Overview of the research process.

Similar articles

References

    1. Belardetti F, Zamponi GW. Calcium channels as therapeutic targets. WIREs Membr Transp Signal. 2012;1(4):433–51. doi: 10.1002/wmts.38 - DOI
    1. Brinzeu A, Berthiller J, Caillet J, Staquet H, Mertens P. Ziconotide for spinal cord injury‐related pain. European Journal of Pain. 2019;23(9):1688–700. doi: 10.1002/ejp.1445 - DOI - PubMed
    1. Zhu J, Chen N, Zhou M, Guo J, Zhu C, Zhou J, et al. Calcium channel blockers versus other classes of drugs for hypertension. Cochrane Database of Systematic Reviews. 2021;2021(10). doi: 10.1002/14651858.cd003654.pub5 - DOI - PMC - PubMed
    1. Kopecky BJ, Liang R, Bao J. T-type calcium channel blockers as neuroprotective agents. Pflugers Arch - Eur J Physiol. 2014;466(4):757–65. doi: 10.1007/s00424-014-1454-x - DOI - PMC - PubMed
    1. Lory P, Nicole S, Monteil A. Neuronal Cav3 channelopathies: recent progress and perspectives. Pflugers Arch - Eur J Physiol. 2020;472(7):831–44. doi: 10.1007/s00424-020-02429-7 - DOI - PMC - PubMed

MeSH terms

Substances

LinkOut - more resources