. 2025 Aug 8;20(8):e0327322.
doi: 10.1371/journal.pone.0327322. eCollection 2025.

Precision-cut tumor tissue slices, a novel tool to study the tumor microenvironment interactions with chimeric antigen receptor (CAR) T cells

Affiliations

Precision-cut tumor tissue slices, a novel tool to study the tumor microenvironment interactions with chimeric antigen receptor (CAR) T cells

Valeria Durante et al. PLoS One. .

Abstract

Up until present day, chimeric antigen receptor (CAR)-T cell therapy has only been approved for hematological malignancies, as CAR-T cells do not show comparable efficacy in solid tumors. Therefore, understanding the features of the tumor microenvironment (TME), is key to improve efficacy of adoptive cell therapies (ACTs) against solid tumors. In this context, robust workflows, which dissect the complex interactions between CAR-T cells and the TME are still lacking. To address this need, we have established an ex vivo workflow co-culturing tissue slices from patient tumor resections with CAR-T cells. The workflow is composed of assessing several complementary attributes, such as cytokine release via flow cytometry, quantification of cell infiltration into the tumor and assessment of the regions of the tissue slice the CAR-T cell infiltrate into by using the MACSima™ imaging cyclic staining technology. Using this workflow it is possible to observe the behavior of CAR-T cells within the tumor and its TME, their infiltration into distinct tumor compartments, as well as to dissect the underlying molecular mechanisms that drive T cell migration, thanks to MACSima™ multiplexing technology and its ability to image several markers at the same time. Assessment of ovarian carcinoma tissue slices revealed substantial release of specific cytokines and increased infiltration of T cells in the tumor areas when CAR-T cells were added to the tissue slices as compared to non-engineered T cells. The establishment of this novel approach will enable researchers to better characterize the interaction between CAR-T cells and the TME. Tissue slices present an intrinsic heterogeneity, which is indeed an advantage compared to other in vitro models but can turn itself into complex results interpretation. Therefore, we recommend that any conclusion derived from this assay should be verified with complementary models.


Conflict of interest statement

Valeria Durante, Alina Wittwer, Benjamin Theek, Manuel Martinez-Osuna, Olaf Hardt, Dominik Eckardt, Andreas Bosio, Sonja Schallenberg and Christoph Herbel are or were employees of Miltenyi Biotec B.V. & Co. KG. This does not alter our adherence to PLOS ONE policies on sharing data and materials

Figures
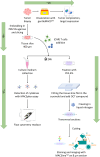
Fig 1
Fig 1. Overview of the workflow with the tissue slices.
Tumor biopsies are split and either dissociated with the GentleMACS™ Octo Dissociator into a single cell suspension for quantitative analysis via flow cytometry, or embedded in agarose to prepare tissue slices of 400 μm thickness to set up the co-cultures. Every 24 hours during the co-culture, aliquots of the co-culture medium are withdrawn and stored at −20 °C for subsequent cytokine detection, while tissue slices are fixed in PFA 4% and kept at 4 °C. The tissue slices are then frozen to next prepare sections of 8 µm, which can be used with the MACSima™ System for the imaging of cyclic stainings on the tissue slices sections.
Fig 2
Fig 2. Composition of human ovarian cancer samples after dissociation.
Five high grade serous ovarian carcinoma (HGSOC) samples (stage III) were freshly dissociated and stained via flow cytometry for dead cells, Ep-CAM cells (used as a surrogate tumor marker), folate receptor 1 (FOLR1, CAR-target), CD45 (leukocytes), Glycophorin-A (GlyA, erythrocytes), CD31 (endothelial cells), and CD90 (fibroblasts) before starting with tissue slices preparation. (A) The percentages of total viable cells (green) in the samples are represented in the graph. (B) The percentages of Ep-CAM+ (yellow), Ep-CAM+ FOLR1+ (orange), CD45+ (blue), GlyA+(pink), CD90+ (teal), and CD31+ (lilac) cells among viable cells in the samples are represented in the graph. (A,B) Each dot represents an individual donor. Median (black continuous line) and quartiles (black dotted line) are shown. An example of the gating strategy used can be seen in Supporting Information S1 Fig. The raw data of the results shown in this figure are collected in Supporting Information S2 File.
Fig 3
Fig 3. Activation of CAR-T cells on tissue slices.
(A) Bright field images of ovarian carcinoma (HGSOC stage III) tissue slices co-cultured with 5 × 105 total T cells, either untransduced (UTD) T cells or FOLR1 CAR-T cells from the same donor (left and right side, respectively), during a time course of 48 hours (top-down). Borders of the tumor tissue within the tissue slices are highlighted by the white dotted line, while clusters of activated T cells are marked by white arrowheads. Scale bar: 182 µm. (B) Granzyme B, IFN-γ, IL-2, and IL-6 secretion after 24h in the co-culture medium of tissue slices where no cells (NT, grey), UTD T cells (light blue) or FOLR1 CAR-T cells (light green) were added. Each point represents a technical replicate. Mean values (black line) with SD are shown. The raw data of the results shown (B) are collected in Supporting Information S2 File.
Fig 4
Fig 4. Exemplary compartments area and marker expression analysis from the co-culture assay of ovarian carcinoma tissue slices with 5 × 105 total T cells, either untransduced (UTD) or FOLR1 CAR-T cells, after 24 hours of co-culture.
(A) Representative images of four MACSimaTM experiments from one donor, showing cytokeratin-7 (white), FOLR1 (CAR-target, coral), collagen type I, III, IV (light blue), and CD3 (yellow) expression in tissue slices without any cell addition (NT), with UTD T cells or FOLR1 CAR-T cells addition. Scale bar: 100 µm. (B) Quantification of tumor (white) and stroma areas (light blue) in tissue slices without any cell addition (NT), with UTD T cells or FOLR1 CAR-T cells addition in several fields of view from four MACSimaTM experiments. (C) Quantification of cytokeratin-7 (white) and FOLR1 (coral) positive cells in several fields of view in tissue slices without any cell addition (NT), with UTD T cells or FOLR1 CAR-T cells addition from four MACSimaTM experiments. (D) Localization of immune cells in tumor (white) and in stroma (light blue) areas from four experiments in tissue slices without any cell addition (NT), with UTD T cells or FOLR1 CAR-T cells addition. Immune cells were identified via CD3, CD11c, and CD163 staining. The percentage of total immune cells in the different areas is written in black inside the bars. (B,C) Each dot represents the value in a field of view. Black line represents the mean. (C,D) Cells were identified after segmentation of the fields of view. (B,D) Tumor and stroma areas were identified respectively via positive cytokeratin-7 staining and via collagen type I, III, IV staining. The raw data of the results shown in (B)-(D) are collected in Supporting Information S2 File. Corresponding H&E stainings of the samples shown in this figure are depicted in Supporting Information S2 Fig.
Fig 5
Fig 5. Exemplary immunophenotyping analysis from the co-culture assay of ovarian carcinoma tissue slices with 5 × 105 total T cells, either untransduced (UTD) or FOLR1 CAR-T cells, after 24 hours of co-culture.
(A) Representative images of four MACSimaTM experiments from one donor, showing cytokeratin-7 (grey), collagen I, III, IV (orange), CD4 (magenta), CD8 (cyan), CD11c (yellow), and CD163 (blue) expression in tissue slices without any T cell addition (NT), with UTD T cells, or FOLR1 CAR-T cells addition. Scale bar: 100 µm. (B) Quantification from four MACSimaTM experiments of the percentages of CD4+ (pink), CD8+ (cyan), CD11c+ (yellow), CD163+ (blue) and CD11c+ CD163+ (white) cells in the whole sample (top row), in tumor (middle row) and in stroma areas (bottom row) in tissue slices without any cell addition (NT, left column), with UTD T cells (central column) or FOLR1 CAR-T cells (right column) addition. Cells were identified after segmentation of the fields of view. For UTD T and FOLR1 CAR-T treated tissue slices, percentages are related to the normalized tumor and stroma area. Tumor and stroma areas in UTD T and FOLR1 CAR-T treated tissue slices are normalized respectively to tumor and stroma areas of the NT tissue slices. Tumor and stroma areas were identified respectively via positive cytokeratin-7 and via collagen type I, III, IV staining. The raw data of the results shown in this figure are collected in Supporting Information S2 File. Corresponding H&E stainings of the samples shown in this figure are depicted in Supporting Information S2 Fig.

Similar articles

References

    1. Ledford H. Engineered cell therapy for cancer gets thumbs up from FDA advisers. Nature. 2017;547(7663):270. - PubMed
    1. Kochenderfer JN, Wilson WH, Janik JE, Dudley ME, Stetler-Stevenson M, Feldman SA, et al. Eradication of B-lineage cells and regression of lymphoma in a patient treated with autologous T cells genetically engineered to recognize CD19. Blood. 2010;116(20):4099–102. doi: 10.1182/blood-2010-04-281931 - DOI - PMC - PubMed
    1. Melenhorst JJ, Chen GM, Wang M, Porter DL, Chen C, Collins MA, et al. Decade-long leukaemia remissions with persistence of CD4+ CAR T cells. Nature. 2022;602(7897):503–9. doi: 10.1038/s41586-021-04390-6 - DOI - PMC - PubMed
    1. Shah NN, Lee DW, Yates B, Yuan CM, Shalabi H, Martin S, et al. Long-Term Follow-Up of CD19-CAR T-Cell Therapy in Children and Young Adults With B-ALL. J Clin Oncol. 2021;39(15):1650–9. doi: 10.1200/JCO.20.02262 - DOI - PMC - PubMed
    1. Administration USFD. FDA approves tisagenlecleucel for B-cell ALL and tocilizumab for cytokine release syndrome. 2017.

MeSH terms