

Spatial epidemiology of tuberculosis diagnostic delays, healthcare access disparities, and socioeconomic inequities in Nairobi County, Kenya
- PMID: 40779529
- PMCID: PMC12333974
- DOI: 10.1371/journal.pone.0329984
Spatial epidemiology of tuberculosis diagnostic delays, healthcare access disparities, and socioeconomic inequities in Nairobi County, Kenya
Abstract
Introduction: Kenya ranks among the top 30 countries with a high tuberculosis (TB) burden globally. With a TB prevalence of 558 per 100,000, only 46% of TB cases are diagnosed and treated, leaving 54% undiagnosed and at risk of spreading the disease. This study analyzed the spatial distribution of tuberculosis diagnostic delays and their association with health care accessibility and socioeconomic inequalities in Nairobi County, Kenya.
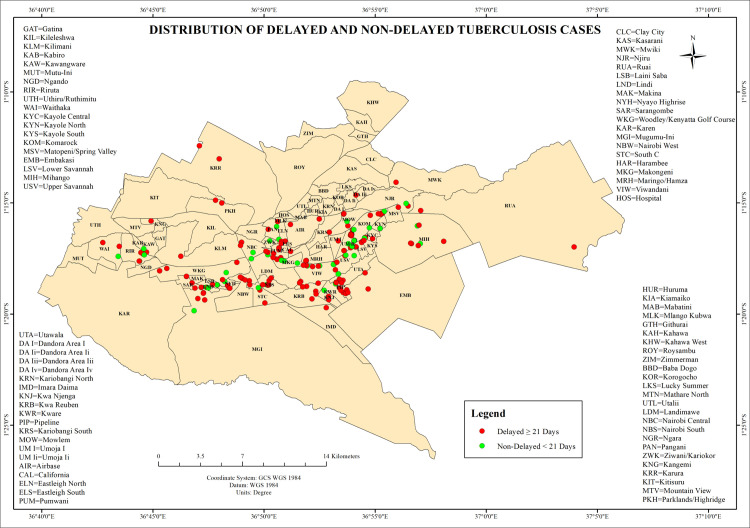
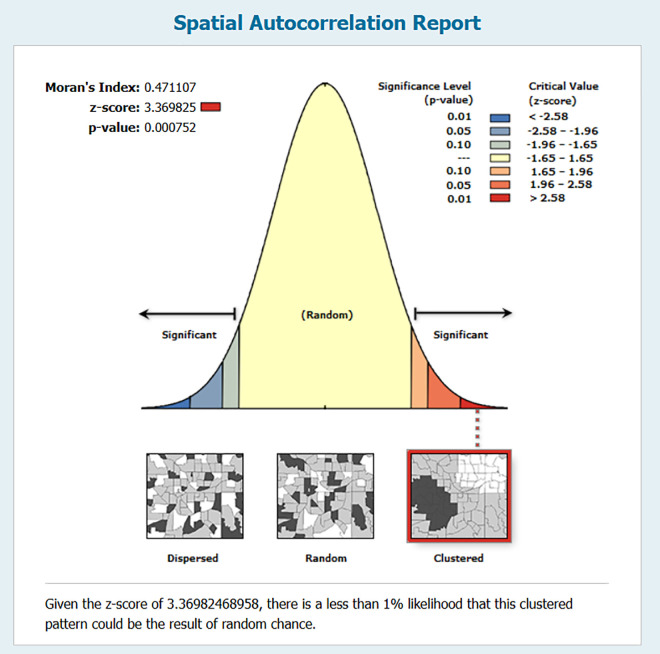
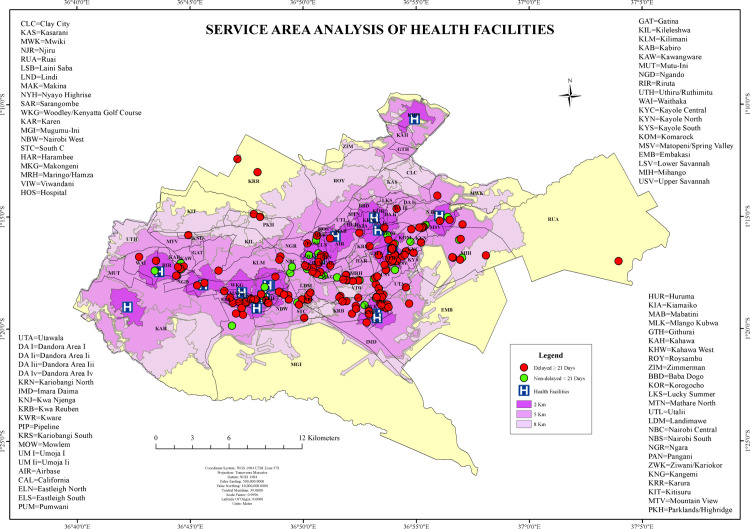
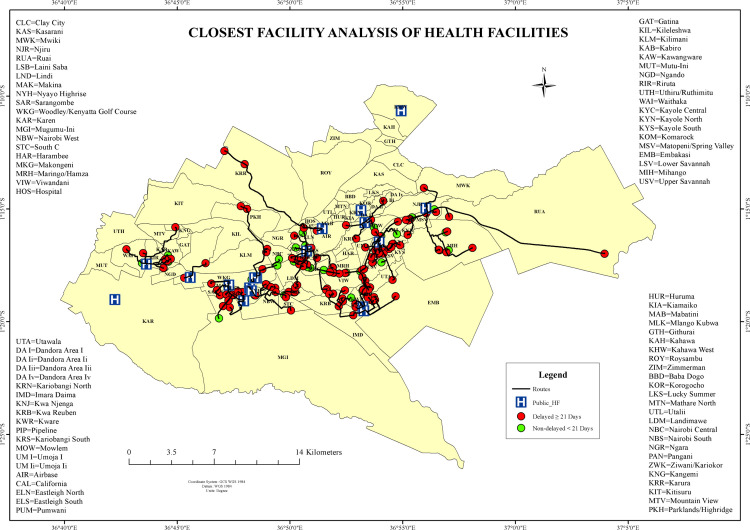
Materials and methods: The cross-sectional study included 222 newly diagnosed bacteriologically confirmed Mycobacterium tuberculosis (Mtb) patients from Mbagathi County Hospital (MCH), Mama Lucy Kibaki Hospital (MLKH), and Rhodes Chest Clinic (RCC) in Nairobi County, Kenya. Patients were recruited consecutively through census sampling and categorized into two groups: delayed diagnosis (≥21 days from symptom onset) and non-delayed (<21 days) as defined by the WHO cutoff point. Patients' residential locations were georeferenced using handheld GPS devices and captured digitally via Kobo Collect. Spatial analyses were performed using ArcGIS Pro, version, where Global Moran's I statistic was used to assess spatial autocorrelation in the distribution of TB cases.
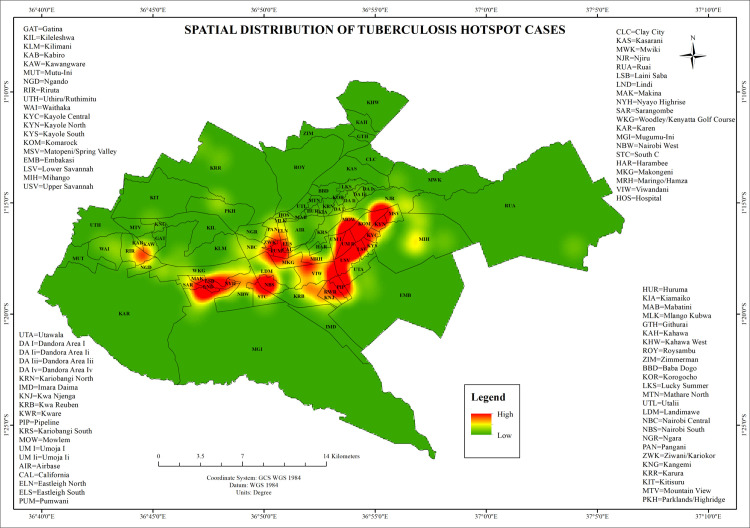
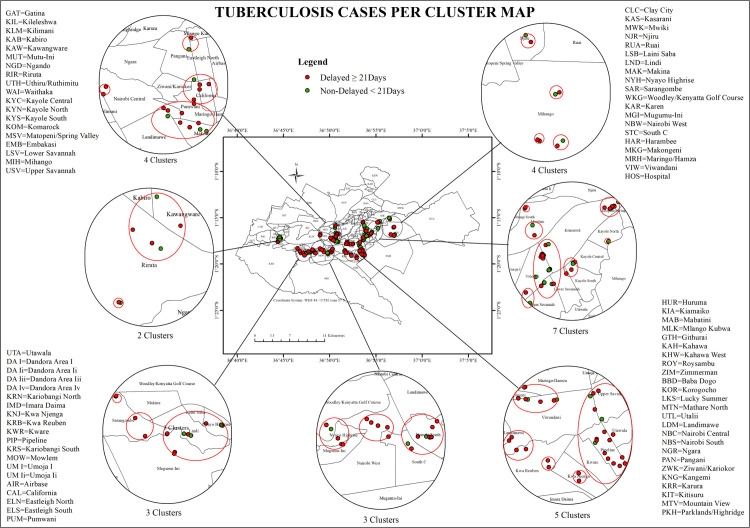
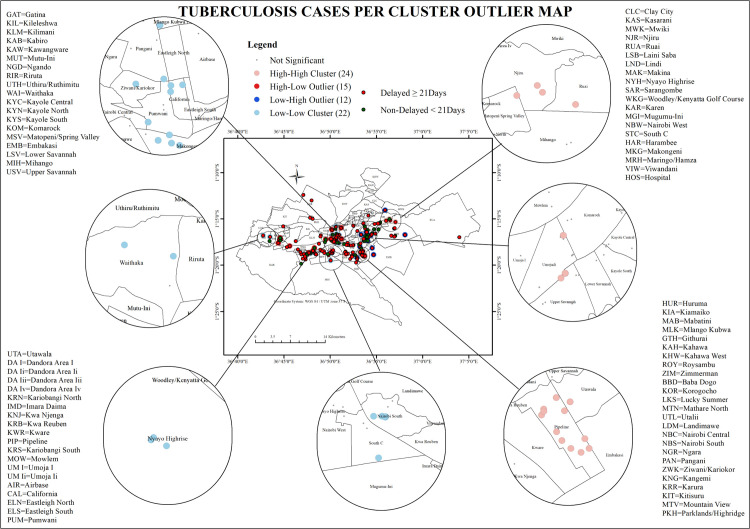
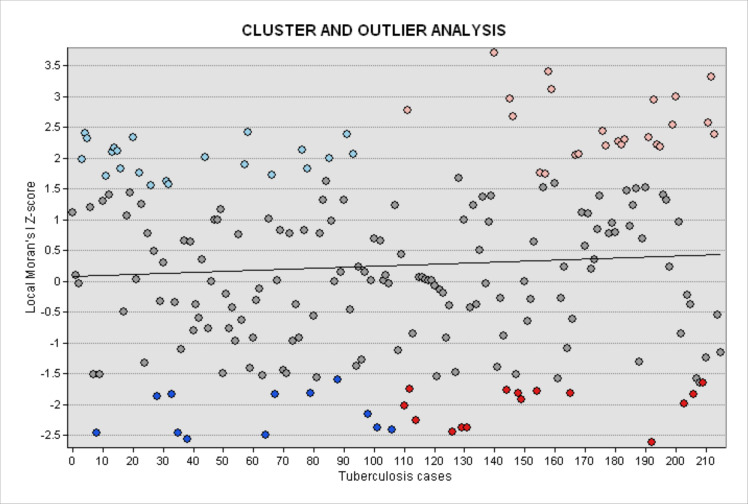
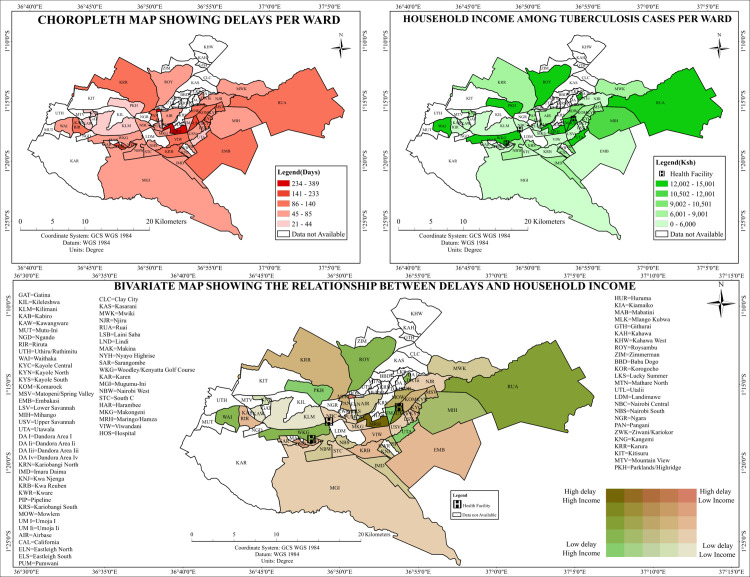
Result: Spatial analyses identified 28 statistically significant clusters of delayed TB diagnoses within Nairobi County. Spatial autocorrelation analysis using Moran's I revealed a significant clustered distribution (Moran's Index = 0.471, z-score = 3.370, p < 0.001). Hotspot analysis with the Getis-Ord Gi* statistic detected high-delay clusters (z > 2.58, p < 0.001) in informal settlements.
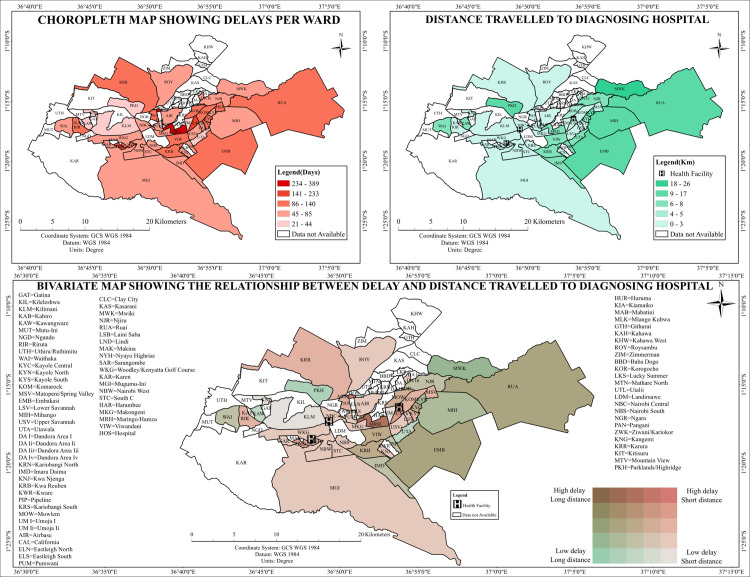
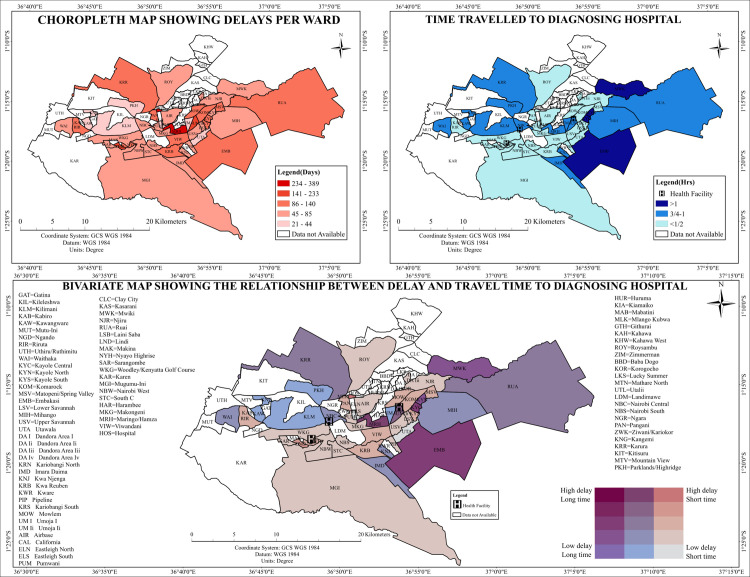
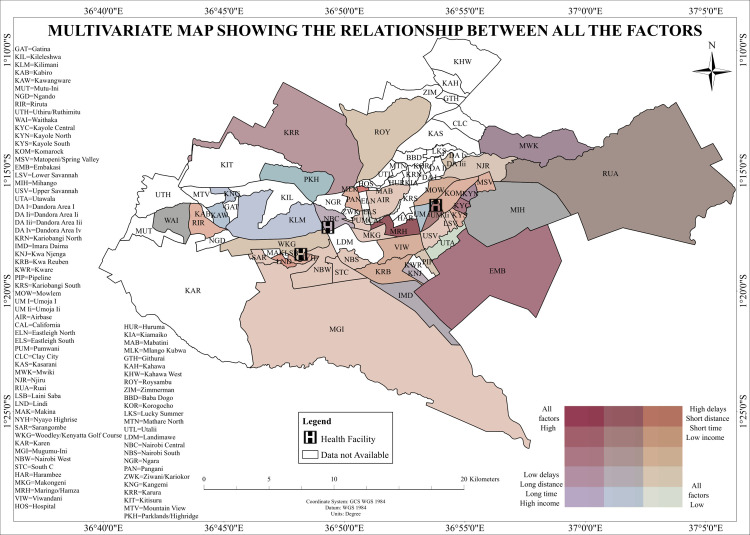
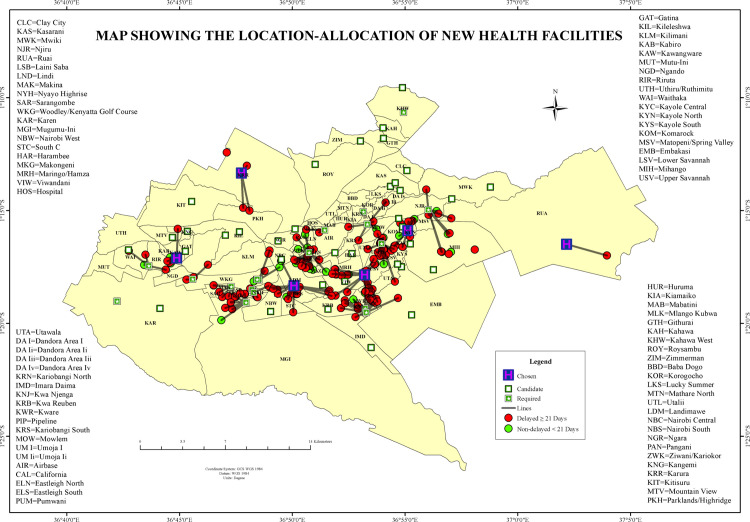
Discussion and conclusion: The study revealed significant spatial clustering of delayed TB diagnoses in Nairobi County, particularly in informal settlements. In contrast, timely diagnoses were predominantly clustered in high-income areas like Lang'ata and Karen. These clusters were significantly associated with lower household income and increased travel time to health facilities which underscored the need for targeted implementation of TB diagnostic services and control measures in the wards with the highest delays.
Copyright: © 2025 Kunjok et al. This is an open access article distributed under the terms of the Creative Commons Attribution License, which permits unrestricted use, distribution, and reproduction in any medium, provided the original author and source are credited.
Conflict of interest statement
The authors have declared that no competing interests exist
Figures
Similar articles
-
Spatiotemporal hotspot analysis of tuberculosis lost to follow-up cases in Ghana: A district-level study from 2019-2023.PLoS One. 2025 Jul 2;20(7):e0326444. doi: 10.1371/journal.pone.0326444. eCollection 2025. PLoS One. 2025. PMID: 40601620 Free PMC article.
-
Rapid molecular tests for tuberculosis and tuberculosis drug resistance: a qualitative evidence synthesis of recipient and provider views.Cochrane Database Syst Rev. 2022 Apr 26;4(4):CD014877. doi: 10.1002/14651858.CD014877.pub2. Cochrane Database Syst Rev. 2022. PMID: 35470432 Free PMC article.
-
Geographical patterns of tuberculosis notification rates and their association with socioeconomic factors in Nepal: a spatial cross-sectional study (2020-2023).BMJ Open. 2025 Jul 22;15(7):e093858. doi: 10.1136/bmjopen-2024-093858. BMJ Open. 2025. PMID: 40701587 Free PMC article.
-
High proportion of tuberculosis recent transmission in rural areas of Northeastern China: a 3-year prospective population-based genotypic and spatial analysis in Hinggan League, China.Microbiol Spectr. 2025 Aug 5;13(8):e0016925. doi: 10.1128/spectrum.00169-25. Epub 2025 Jul 11. Microbiol Spectr. 2025. PMID: 40643231 Free PMC article.
-
Xpert® MTB/RIF assay for pulmonary tuberculosis and rifampicin resistance in adults.Cochrane Database Syst Rev. 2014 Jan 21;(1):CD009593. doi: 10.1002/14651858.CD009593.pub3. Cochrane Database Syst Rev. 2014. Update in: Cochrane Database Syst Rev. 2019 Jun 07;6:CD009593. doi: 10.1002/14651858.CD009593.pub4. PMID: 24448973 Free PMC article. Updated.
References
-
- World Health Organization. Global tuberculosis report 2024. Geneva: WHO. 2024.
-
- World Health Organization. Global tuberculosis report 2023. Geneva: WHO. 2023.
-
- Ministry of Health Kenya. Kenya tuberculosis prevalence survey 2016. Nairobi: MoH. 2016.
-
- Ministry of Health Kenya. National Tuberculosis, Leprosy and Lung Disease Program Annual Report. Nairobi: Republic of Kenya, MoH. 2015.
MeSH terms
LinkOut - more resources
Full Text Sources
Medical
Research Materials
