

Spatial distribution and factors associated with coexisting undernutrition among under-five children in Ethiopia: Evidence from the 2019 Mini-Demographic and Health Survey
- PMID: 40779545
- PMCID: PMC12334006
- DOI: 10.1371/journal.pone.0329750
Spatial distribution and factors associated with coexisting undernutrition among under-five children in Ethiopia: Evidence from the 2019 Mini-Demographic and Health Survey
Abstract
Background: Undernutrition remains a critical public health issue in Ethiopia, driving high under-five morbidity and mortality. Coexisting forms; stunting, wasting, and underweight magnify these risks but their spatial patterns and determinants remain poorly understood. This study investigates the geographic distribution and key factors of coexisting undernutrition among Ethiopian children under five to inform targeted, geographic-specific interventions.
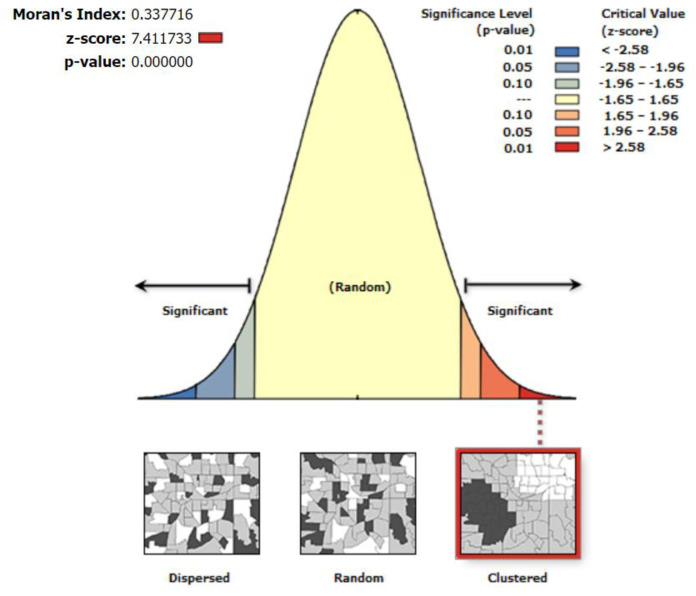
Methods: We conducted a secondary data analysis of the 2019 Ethiopia Mini Demographic and Health Survey (EMDHS), including a weighted sample of 4,952 children under five years of age. Spatial analysis was employed to explore the geographic distribution of coexisting forms of undernutrition, and significant spatial clusters were identified using SaTScan version 10. To examine associated factors, a multilevel binary logistic regression model was fitted. Variables with a p-value < 0.2 in the bivariable analysis were included in the multivariable model. Effect measures were reported using Adjusted Odds Ratios (AORs) with 95% Confidence Intervals (CIs).
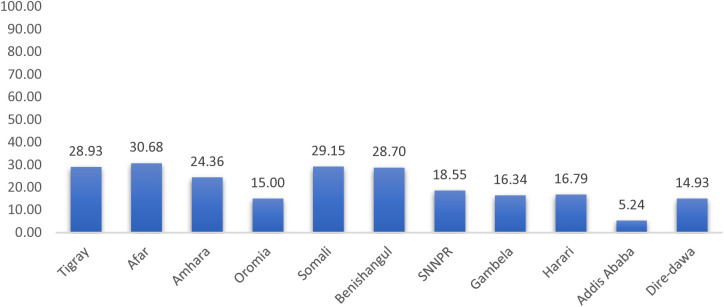
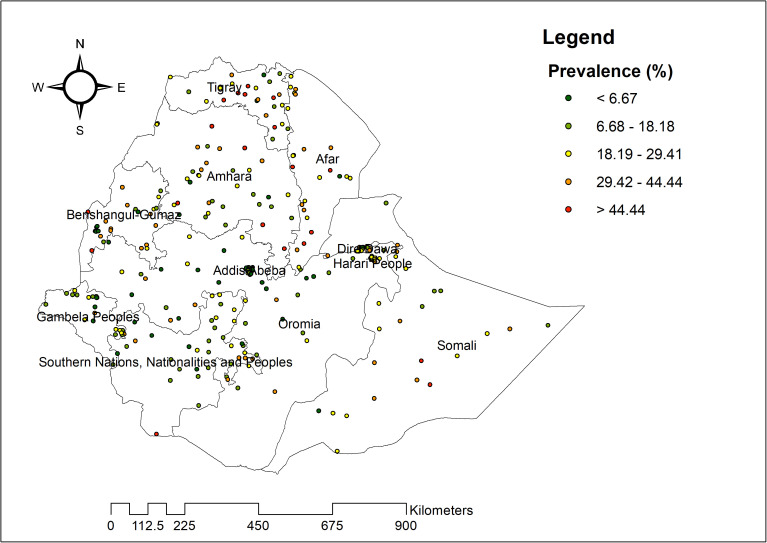
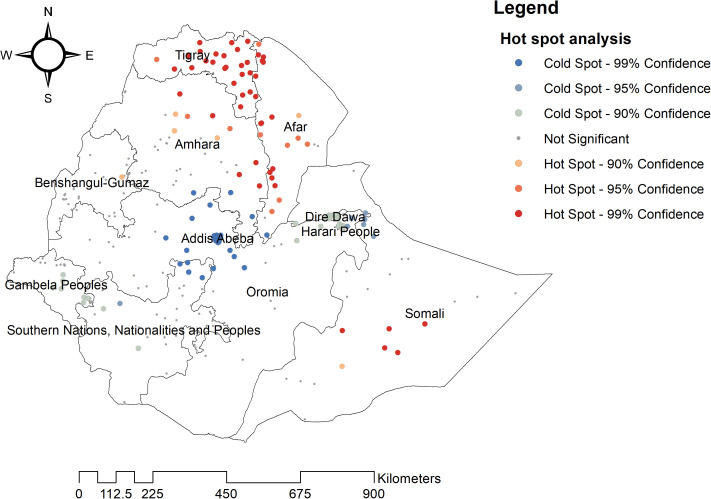
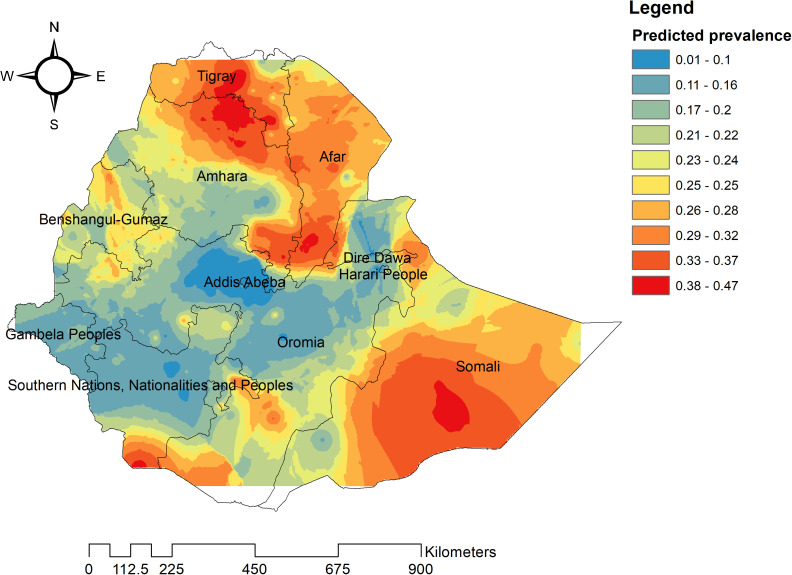
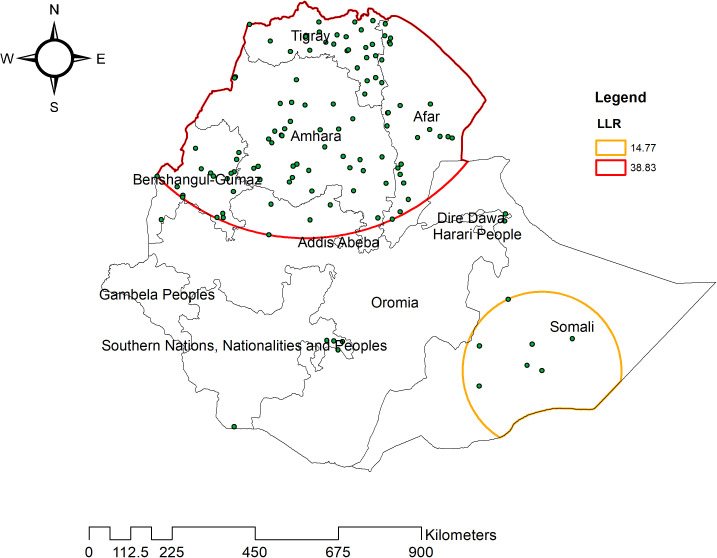
Results: The national prevalence of coexisting forms of undernutrition among children under five in Ethiopia was 19.6% (95% CI: 18.5,20.7), with marked regional disparities ranging from 5.2% in Addis Ababa to 30.7% in the Afar region. Spatial analysis identified a significant high-risk cluster spanning Afar, Amhara, Tigray, Benishangul-Gumuz, and northern Somali regions (Log-Likelihood Ratio [LLR] = 38.83, p < 0.001), indicating pronounced geographic heterogeneity. Maternal education at primary (AOR = 0.81, 95% CI: 0.68, 0.98), secondary (AOR = 0.53, 95% CI: 0.37, 0.77), and higher levels (AOR = 0.29, 95% CI: 0.17, 0.51), higher household wealth (richer: AOR = 0.68, 95% CI: 0.50, 0.92; richest: AOR = 0.53, 95% CI: 0.35, 0.80), and female sex (AOR = 0.80, 95% CI: 0.69, 0.92). Conversely, multiple births (AOR = 2.06, 95% CI: 1.33, 3.18) and residing in communities with high poverty levels (AOR = 1.44, 95% CI: 1.11, 1.87) significantly increased the risk of coexisting undernutrition.
Conclusion: Significant geographic disparities in coexisting undernutrition among Ethiopian children under five highlight urgent hotspots in Afar, Amhara, Tigray, Benishangul, and northern Somali regions. Protective factors such as maternal education, household wealth, and female sex, while multiple births and poverty were risk factors. These findings highlight the need for geographically targeted interventions focused on hotspot areas, with an emphasis on improving maternal education and alleviating poverty to reduce coexisting forms of undernutrition and enhance child survival.
Copyright: © 2025 Bezie, Tesema. This is an open access article distributed under the terms of the Creative Commons Attribution License, which permits unrestricted use, distribution, and reproduction in any medium, provided the original author and source are credited.
Conflict of interest statement
The authors have declared that no competing interests exist.
Figures
References
-
- Winichagoon P, Margetts BM. The double burden of malnutrition in low-and middle-income countries. Energy Balance and Obesity. 2017. - PubMed
-
- Obayelu AE. A preventable tragedy: how close is Africa to end hunger and malnutrition in all its forms by 2030? African Journal of Food, Agriculture, Nutrition and Development. 2019;19(3):1–5.
-
- Caulfield LE, et al. Stunting, wasting, and micronutrient deficiency disorders. 2nd ed. Disease Control Priorities in Developing Countries; 2006.
-
- Mutunga M, Frison S, Rava M, Bahwere P. The Forgotten Agenda of Wasting in Southeast Asia: Burden, Determinants and Overlap with Stunting: A Review of Nationally Representative Cross-Sectional Demographic and Health Surveys in Six Countries. Nutrients. 2020;12(2):559. doi: 10.3390/nu12020559 - DOI - PMC - PubMed
-
- Uzogara SG. Underweight, the less discussed type of unhealthy weight and its implications: a review. American Journal of Food Science and Nutrition Research. 2016;3(5):126–42.
MeSH terms
LinkOut - more resources
Full Text Sources
Medical
