. 2025 Aug 8;11(32):eadx0092.
doi: 10.1126/sciadv.adx0092. Epub 2025 Aug 8.

An energy-embodied paralleled liquid manipulation for equipment-free, quantitative multiplexed liver function monitoring

Affiliations

An energy-embodied paralleled liquid manipulation for equipment-free, quantitative multiplexed liver function monitoring

Chao Liang et al. Sci Adv. .

Abstract

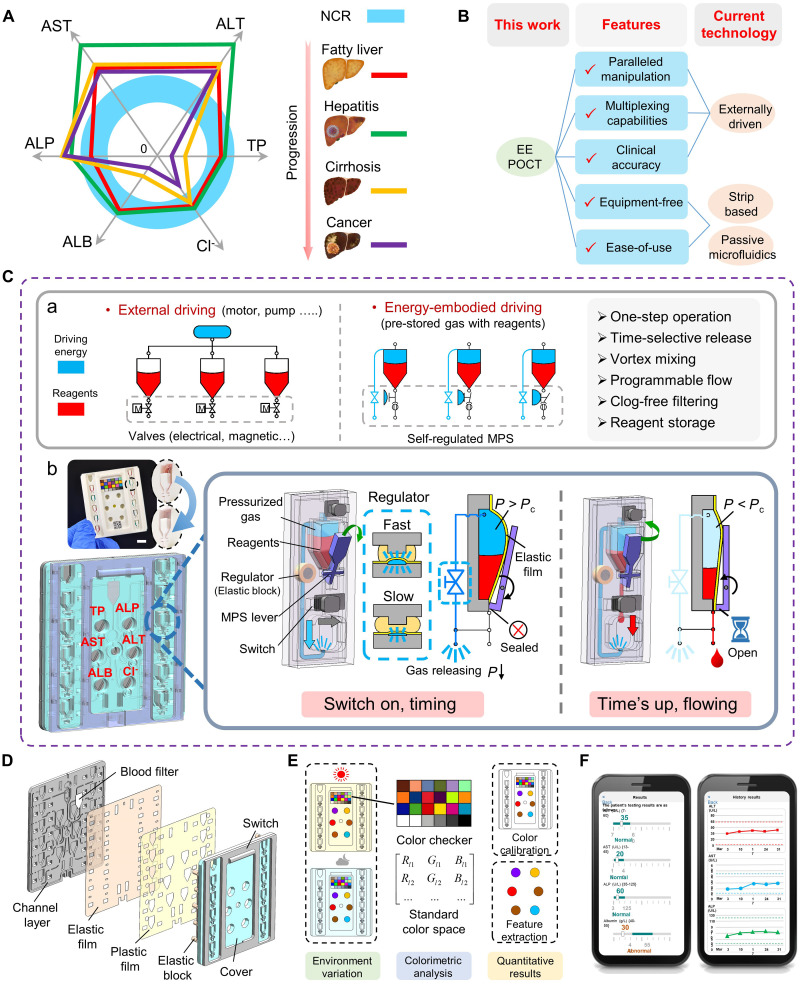
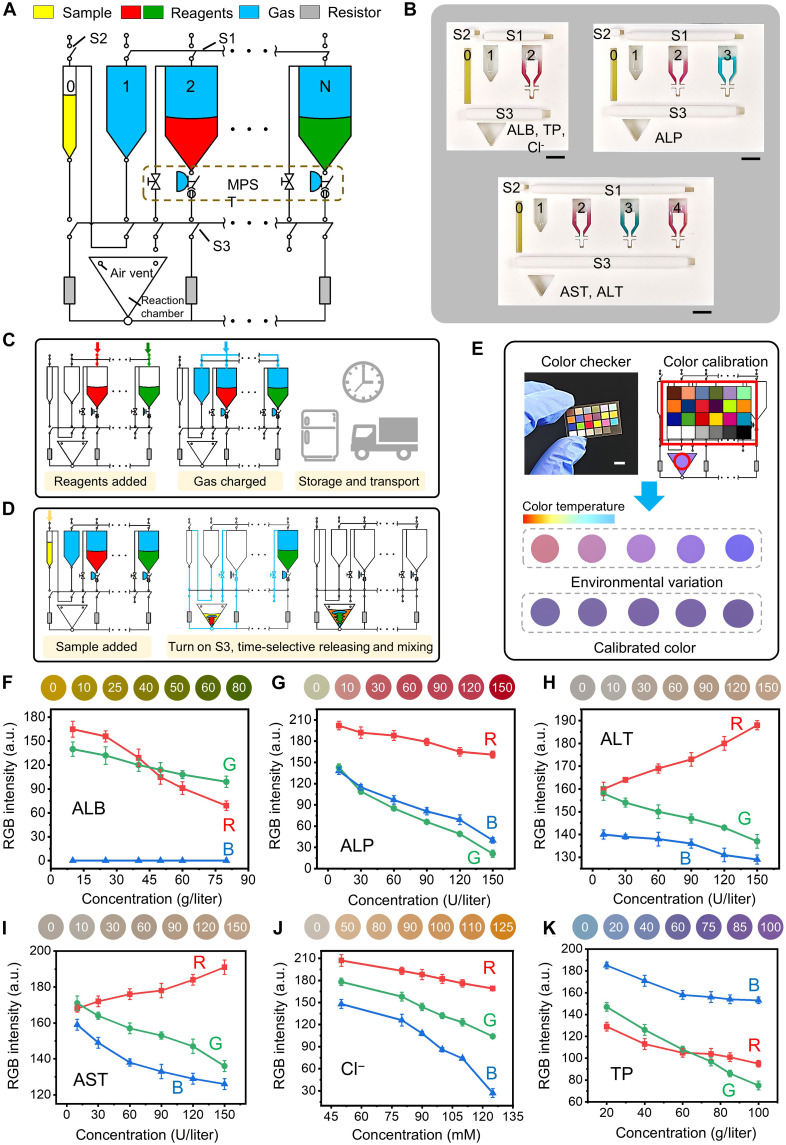
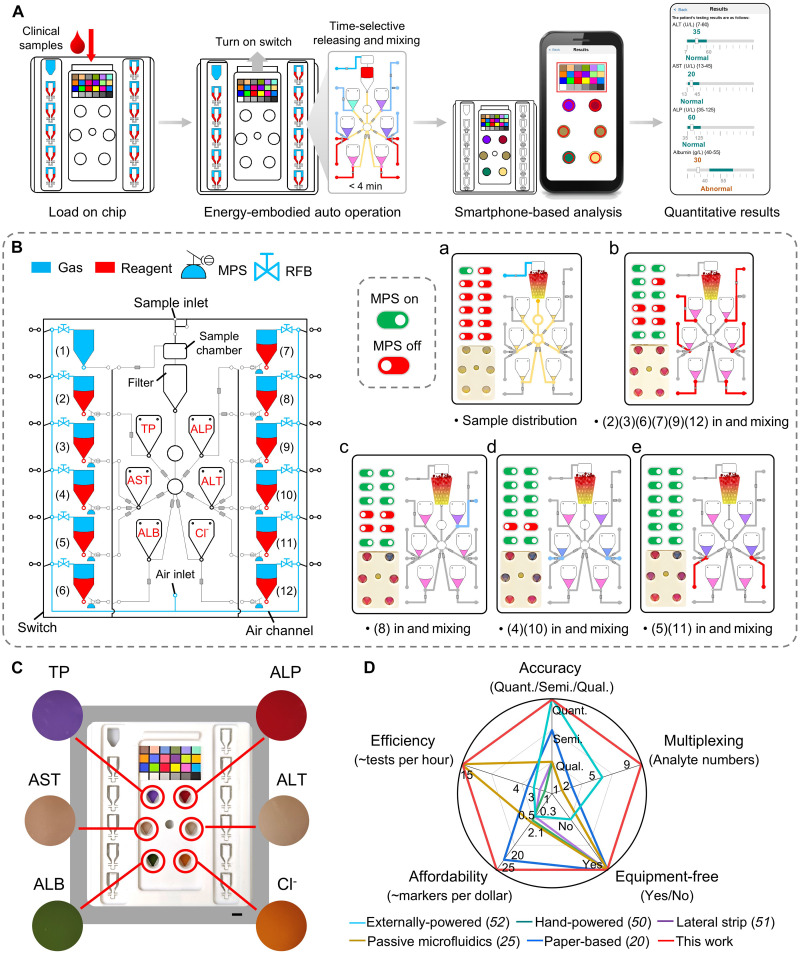
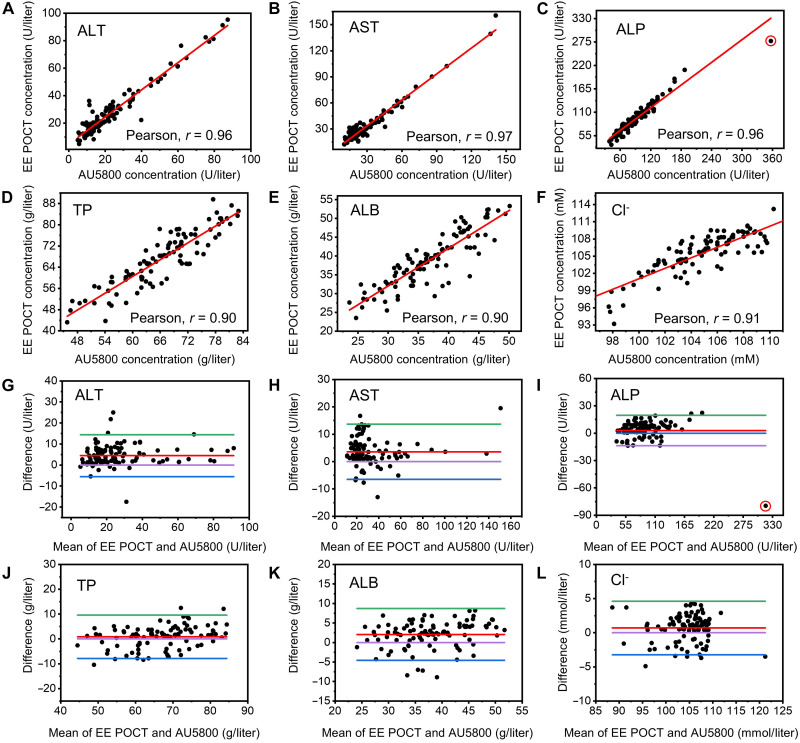
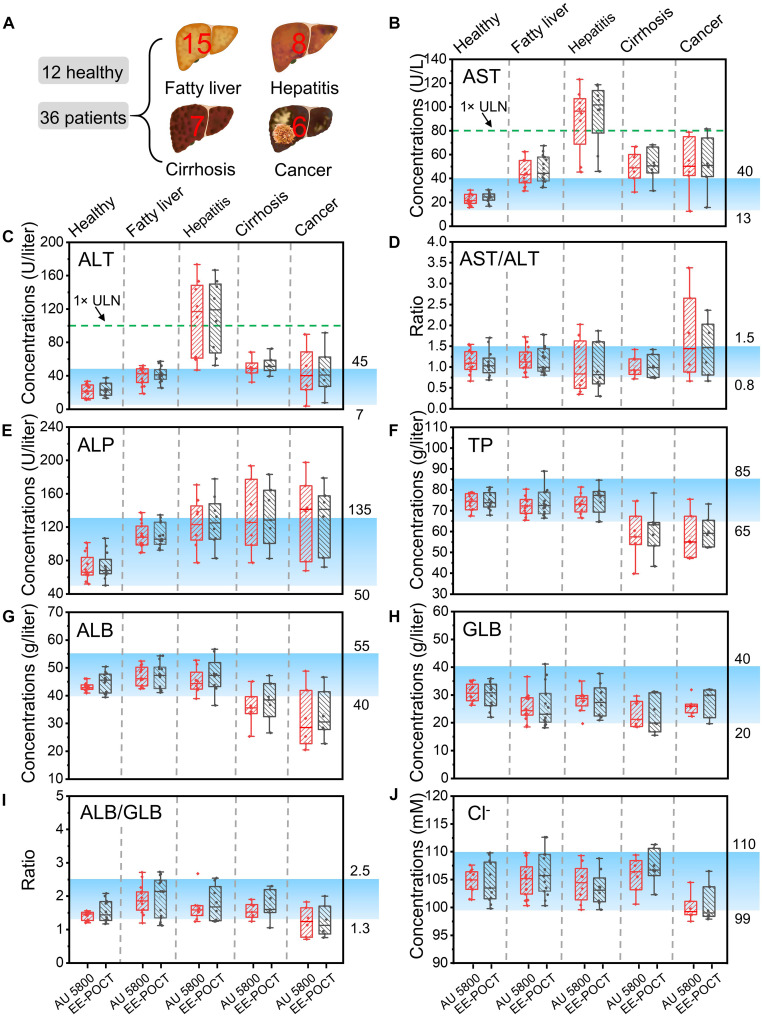
Comprehensive liver function monitoring is vital for liver damage diagnoses. However, multiplexed testing with clinical accuracy often requires paralleled liquid manipulation to avoid reagent interference and nonspecific adsorption, making it restricted to centralized facilities and specialists. Here, we report an equipment-free, quantitative, and multiplexed point-of-care testing (POCT), the energy-embodied POCT (EE-POCT). The driving energy (pressured gas) and liquid reagents are embodied in separate rigid-flexible chambers through a mechanical pressure sensing mechanism to achieve a paralleled, interference-free, and multiple-reagent operation with no need for external equipment. The EE-POCT achieves quantitative results for nine liver-related indicators from 180 microliters of whole blood within 4 minutes. Validated with 103 clinical specimens, it shows high concordance with a clinical gold standard analyzer (Pearson coefficients >0.9). The EE-POCT platform not only advances liver health diagnostics but also sets a precedent for developing versatile, accessible medical technologies that can significantly affect global health outcomes.


Figures

Fig. 1.
Fig. 1.. Energy-embodied point-of-care test (EE-POCT).
(A) A combination of biomarkers can comprehensively reflect the liver conditions from mild fatty liver to severe cirrhosis. NCR indicates normal clinical range. (B) Features of the EE-POCT compared with current POCT technologies. (C) Mechanism of the energy-embodied microfluidics. (a) Comparison of paralleled manipulation for the external driving and energy-embodied driving. (b) Schematic view of the EE-POCT technology. The inset is a picture of the EE-POCT platform with a scale bar of 6 mm. (D) Expanded view schematic diagram of the EE-POCT platform. (E) Colorimetric analysis algorithm. (F) Custom mobile application for quantitative liver function monitoring.
Fig. 2.
Fig. 2.. Materials and characterization for the colorimetric assay.
(A, D, G, J, M, and P) The materials and operation steps. (B, E, H, K, N, and Q) The reaction time for optimal colorimetric readouts. (C, F, I, L, O, and R) The linearity for color intensity versus concentrations; for ALB, TP, Cl, ALP, ALT, and AST, respectively. The inserted figures in (C), (F), (I), (L), (O), and (R) are UV-vis spectroscopy results and the inserted pictures are the colorimetric images under different biomarker concentrations.
Fig. 3.
Fig. 3.. Design and working principles of the energy-embodied microfluidics.
(A) Schematic of the device components and the charging process of pressurized gas. By one-step turning off the switch, pressurized gas can be robustly stored in the chamber. (B) Sealing performance of the EE device by pressing the elastic film using a tensile machine for 300 cycles. (C) Storage characterization under various temperatures and pressures. (D) Mechanism and results for the programmable flow tests. The inset is the device used in the testing process. (E) Comparison of the energy-embodied and conventional whole blood filtering. The inset is the picture of the flow behavior with the dashed lines indicating the flow surface. (F) Vortex mixing results. For all the above experiments, three independent experiments were conducted with the data shown as ±SD. Scale bars, 6 mm.
Fig. 4.
Fig. 4.. Mechanism of time-selective releasing.
(A) Flowchart illustrating the relationship between the pressure release process of MPST and time control. (B) Upon activating the switch, the prestored gas is released, and the release rate is regulated by the parameter λ of RFB. (C) As the pressure decreases, the MPS lever gradually returns to its original position, determining the timing behavior. The plot shows the relationship between release time and gas pressure in the chamber. The inset compares the critical pressure versus MPS lever length based on both theoretical modeling and experimental data. (D) When the pressure P reducing to critical pressure Pc, the liquid in chamber is released. A linear curve of the parameter λ and the releasing time is presented. The inset shows representative experimental images for λ = 1.4. For all the above experiments, three independent experiments were conducted with the data shown as ± SD. Scale bars, 6 mm.
Fig. 5.
Fig. 5.. EE-POCT device and colorimetric analysis for multiplexed biomarkers.
(A) Schematic view of the EE-POCT device with mechanical pressure self-sensing timer (MPST), resistor, and switches. (B) The pictures of three EE systems for biomarkers with different operation steps. (C) The preparation and (D) application of the EE-POCT device. (E) Color analysis method using a standard color checker. Standard calibration curves between RGB value and concentration of markers for (F) ALB, (G) ALP, (H) ALT, (I) AST, (J) Cl, and (K) TP. For all the above experiments, n = 3 independent experiments were conducted with the data shown as ±SD. Scale bars, 6 mm.
Fig. 6.
Fig. 6.. Demonstration of an all-in-one EE POCT system.
(A) Working flow of the all-in-one EE system. The users only need to add 180 μl of whole blood sample and turn on the switch; within 4 min, the system is capable of dealing with the prestored 11 reagents and achieving nine direct and three indirect quantitative results. (B) Schematic view of the all-in-one EE POCT system with (a) to (e) demonstrating the energy-embodied auto operation procedures. (C) Picture of the system and the colorimetric readouts for the six detection zones. Scale bar, 6 mm. (D) Radar image for the comparison on the current POCT technologies (, , –52).
Fig. 7.
Fig. 7.. Clinical validations using the all-in-one EE POCT system.
Direct comparison of the quantitative results made by the system and the standard commercialized analyzer (AU5800) for (A) ALT, (B) AST, (C) ALP, (D) TP, (E) ALB, and (F) Cl. The red line corresponds to the line of equality. The red circle in (C) is deviated data. (G), (H), (I), (J), (K), and (L) are Bland-Altman plots of the testing in clinical samples for ALT, AST, ALP, TP, ALB, and Cl, respectively. The green and blue lines represent the 95% limits of agreement. The purple line is the line of equality, and the red line is the average different of the methods. The red circle in (I) is obvious deviated data.
Fig. 8.
Fig. 8.. Correlations between biomarkers and specific liver diseases.
(A) Samples of healthy individuals (n = 12), fatty liver (n = 15), viral hepatitis (n = 8), cirrhosis (n = 7), and liver cancer (n = 6) used in the experiments. Box-and-whisker plot of the concentrations of (B) AST, (C) ALT, (D) AST/ALT, (E) ALP, (F) TP, (G) ALB, (H) GLB, (I) ALB/GLB, and (J) Cl. For each plot, the central black mark indicates the median, and the bottom and top lines of the box indicate the 25th and 75th percentiles, respectively. The whiskers extend to the min-max data points that were not considered outliers. The blue bands in the plots indicate NCR for each biomarker. The green dashed lines in (B) and (C) mean the ULN.

Similar articles

References

    1. Gao B., Jeong W.-I., Tian Z., Liver: An organ with predominant innate immunity. Hepatology 47, 729–736 (2007). - PubMed
    1. Chalasani N., Younossi Z., Lavine J. E., Diehl A. M., Brunt E. M., Cusi K., Charltion M., Sanyal A. J., American Gastroenterological Association, American Association for the Study of Liver Diseases, American College of Gastroenterologyh , The diagnosis and management of non-alcoholic fatty liver disease: Practice guideline by the American Gastroenterological Association, American Association for the Study of Liver Diseases, and American College of Gastroenterology. Gastroenterology 142, 1592–1609 (2012). - PubMed
    1. Xin S., Xu J., Yu Y., Abnormal liver function tests of patients with Coronavirus disease 2019 in mainland China: A systematic review and meta- analysis. J. Gastrointestin. Liver Dis. 29, 219–226 (2020). - PubMed
    1. Cai Q., Huang D., Yu H., Zhu Z., Xia Z., Su Y., Li Z., Zhou G., Gou J., Qu J., Sun Y., Liu Y., He Q., Chen J., Liu L., Xu L., COVID-19: Abnormal liver function tests. J. Hepatol. 73, 566–574 (2020). - PMC - PubMed
    1. Devarbhavi H., Asrani S. K., Arab J. P., Nartey Y. A., Pose E., Kamath P. S., Global burden of liver disease: 2023 update. J. Hepatol. 79, 516–537 (2023). - PubMed

LinkOut - more resources