. 2025 Aug 8;11(32):eadq6320.
doi: 10.1126/sciadv.adq6320. Epub 2025 Aug 8.

Nonlinear spatial integration allows the retina to detect the sign of defocus in natural scenes

Affiliations

Nonlinear spatial integration allows the retina to detect the sign of defocus in natural scenes

Sarah Goethals et al. Sci Adv. .

Abstract

Eye growth is regulated by the visual input. Many studies suggest that the retina can detect whether a visual image is focused in front of or behind the back of the eye and modulate eye growth to bring it back to focus. How can the retina distinguish between these two types of defocus? Here, we simulated how eye optics transforms natural images and recorded how the isolated retina responds to different types of simulated defocus. We found that some ganglion cell types could distinguish between an image focused in front of or behind the retina by estimating spatial contrast. Aberrations in the eye optics made spatial contrast, but not luminance, a reliable cue to distinguish these two types of defocus. Our results suggest a mechanism for how the retina can estimate the sign of defocus and provide an explanation for several results aiming at mitigating strong myopia by slowing down eye growth.


Figures
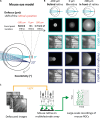
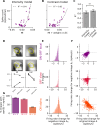
Fig. 1.
Fig. 1.. Mouse eye model to simulate retinal images.
(A) Mouse eye model and its parameters. First, the light source eccentricity: Light rays can reach the retina in the center (0°, light blue) or periphery (20°, dark blue). Second, the position of the retina with respect to the focal point (defocus, in μm). In the model, we kept the eye optics fixed and simulated a change of defocus by moving the position of the retina. Negative values of defocus correspond to the retina being shifted in front of the focal point, and therefore the image becomes focused behind the retina (hyperopic defocus). Positive values of defocus correspond to the retina being shifted behind the focal point, and therefore the image becomes focused in front of the retina (myopic defocus). (B) Top: Mouse eye model when the image is focused behind (left), on (center), or in front of (right) the retina. Bottom: PSFs (first and third rows) and the corresponding retinal image (second and fourth rows) for simulated central (0°, light blue) and peripheral (20°, dark blue) eye optics, when the image is focused behind (left), on (center), or in front of (right) the retina. (C) Experimental preparation. Natural images transformed by the eye optics (left) are projected on an ex vivo mouse retinal flattened on a MEA (center) to record RGC’s responses (right). RGCs are represented in green. The raster plot on the right is the spiking activity of one cell in response to 30 presentations of the same image during 300 ms. The gray area corresponds to the presentation of a gray frame during 300 ms. Credit for the natural images shown here goes to H. Van Hateren (87).
Fig. 2.
Fig. 2.. Specific types of retina ganglion cells could signal the sign of defocus.
(A) Chirp stimulus (see Materials and Methods). Scale bar, 2 s. (B) Example RGC response to the chirp stimulus. Top: ON-OFF local; middle: OFF slow; bottom: ON alpha. Horizontal scale bar, 2 s. Vertical scale bar, 20 spikes/s. (C) Four images that were defocused and flashed on the retina during MEA experiments. Scale bar, 500 μm. (D) Firing rate as a function of defocus for the images in (C) and for three example cells, for simulated peripheral eye optics (20°). Top: ON-OFF local; middle: OFF slow; bottom, ON alpha. Data are represented as means ± SD. (E) Raw response of an ON alpha cell to the “blue” image for simulated peripheral eye optics (20°): firing rate during image (white area) and gray frame (gray area) presentation for a defocus of −200 μm (dark blue), 0 μm (blue), and 200 μm (light blue). The vertical dashed lines represent the time range during which we measure the firing rate. (F) Proportion of images and cells leading to a firing rate change ∆ [between defocus of +200 μm and defocus of −200 μm; see (D), bottom left], that is strictly negative (left bar plot) or strictly positive (right bar plot). Left (right) column: simulated central (peripheral) eye optics (0°) (20°). Top: ON-OFF local (N = 7 cells x 4 images), center: P = 1 × 10⁻²; periphery: P = 1 × 10⁻². Middle: OFF slow (N = 9 cells x 4 images), center: P = 5 × 10⁻⁵; periphery: P = 1 × 10⁻². Bottom: ON alpha (N = 55 cells x 4 images), center: P = 0.1; periphery: P = 0.9). One-sided Wilcoxon signed-rank test. Credit for the natural images shown here goes to (87). *P ≤ 0.5; ****P ≤ 0.0001; n.s., not significant.
Fig. 3.
Fig. 3.. A CNN model accurately predicts RGC response to defocused images and confirms that two types almost always decrease their activity when the focus switched from negative to positive.
Data of (B), (D), (E), and (F) are shown for simulated peripheral eye optics (20°). For (C), all eccentricities and defocusses were pooled. (A) Schematic of the CNN model architecture. Adapted from (45). (B) Example of an ON alpha cell’s response (full lines) to the images shown on the right, and the predictions of the CNN model (dashed lines). The orange ellipse on the images is the receptive field of the cell. Scale bar, 200 μm. (C) Average performance of the model at predicting the response to repeated not defocused (left) and repeated defocused natural images (right). Data from N = 3 ON-OFF local cells (top), N = 4 OFF slow cells (middle) and N = 15 ON alpha cells (bottom). Data are represented as means ± SEM. (D) Distribution over N = 1000 images of the change in predicted firing rate ∆ between defocus of 200 and −200 μm for an ON-OFF local (top), an OFF slow (middle), and an ON alpha (bottom) example cells. (E) Same as (D) for all the modeled cells. Top: ON-OFF local (N = 3 cells x 1000 images). Middle: OFF slow (N = 4 cells x 1000 images). Bottom: ON alpha (N = 15 cells x 1000 images). (F) Proportion of images and cells leading to a firing rate change ∆ (between defocus of +200 μm and defocus of −200 μm), that is strictly negative (left bar plot) or strictly positive (right bar plot). N is as for (D). Top: ON-OFF local (P = 0); middle: OFF slow (P = 0); bottom: ON alpha (P = 0.1); one-sided Wilcoxon signed-rank test. ****P ≤ 0.0001; n.s., not significant.
Fig. 4.
Fig. 4.. A simple contrast model and the predicted responses to negative images confirm that defocus detectors encode the LSC.
Data of (D), (E), (F), and (G) are for simulated central eye optics (0°). For simulated peripheral eye optics, see fig. S2. (A) Average firing rate as a function of MI in the receptive field for an ON-OFF local RGC for the test set images (see Materials and Methods). The gray line represents the fit of the intensity model. (B) Same as (A) for the MI + LSC. (C) Distributions of the coefficient of determination R2 for the intensity model (left, R2 = 0.65 ± 0.05) and the spatial contrast model (right, R2 = 0.72 ± 0.04) over all defocus detector (N = 15, P = 3 × 10⁻³, one-sided Wilcoxon signed-rank test). Data are represented as means ± SEM. (D) Sharp (left) and defocused (right, defocus = 200 μm) image (top) and its bright-dark inverse (middle), with the receptive field of an example cell. Scale bar, 200 μm. Bottom: MI and LSC for the original (full line) and the negative (dashed line) image. (E) Distribution over 1000 images of the change of firing rate ∆ between 200 and −200 μm in response to the negative defocused images. Top: ON-OFF local cell. Middle: OFF slow cell. Bottom: ON alpha cell. (F) Change of firing rate in response to the negative images versus change of firing rate in response to the original images for the cells of (E). Each dot represents an image. (G) Average (over cells, means ± SEM) of the proportion of images leading to a firing rate change ∆n, that as the same sign as the firing rate change ∆ for the original image. Left: ON-OFF local; middle: OFF slow; right: ON alpha. **P ≤ 0.01.
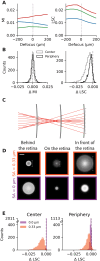
Fig. 5.
Fig. 5.. Spherical aberrations are necessary to detect the sign of defocus with the computation of LSC.
(A) MI (left) and LSC (right) as a function of defocus for three different images (red, green, and blue curves, same color code as in Fig. 2C) and simulated peripheral eye optics (20°), computed in the receptive field of an example cell. (B) Distribution of the difference in MI (left) and the difference in LSC (right) over N = 511 cells x 4 images, between defocus of −200 and 100 μm. Gray (black), in images corresponding to the simulated central (peripheral) eye optics. (C) Schematic illustrating the spherical aberrations in a mouse eye model with pupil diameter = 1.4 mm. The middle gray thick line represents a retina located at the focal point. The left (right) gray line represents a situation where the focal point would be located behind (in front of) the retina. (D) Top row: PSFs with spherical aberrations (SA = 0.33 μm, PSF shown in log scale) corresponding to the positions of the three different retinas in (C), for simulated central eye optics (0°). Bottom row: PSFs at the same positions but without spherical aberrations. Scale bar, 50 μm. (E) Distribution of the difference in LSC over N = 511 cells x 4 images, with spherical aberrations (orange) and without (purple). Left (right): In images corresponding to the simulated central (peripheral) eye optics.
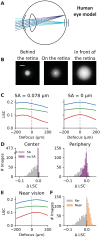
Fig. 6.
Fig. 6.. Reduced spherical aberrations make the LSC more ambiguous to determine the sign of defocus.
In (C), (E), and (F), the LSC is calculated in images corresponding to simulated central eye optics (0°). (A) Human eye model. The light rays can reach the retina in the center (0°, light blue) or periphery (20°, dark blue) of the retina. The pupil diameter is 5 mm. (B) PSFs of the simulated central eye optics when the image is focused behind (left), on (center), or in front of (right) the retina. Scale bar, 50 μm. (C) LSC as a function of defocus for three example images (color code as Fig. 2C) with (left) and without (right) spherical aberrations. (D) Distribution of the difference in LSC between 200 and −200 μm over N = 500 images, with spherical aberrations (gray, SA = 0.078 μm) and without (purple). Left (right): In images corresponding to the simulated central (peripheral) eye optics. (E) LSC as a function of defocus for three example images (color code as Fig. 2C) in near vision (focus proximity = 2.5 D). (F) Distribution of the difference in LSC between 200 and −200 μm over N = 500 images, for a model with spherical aberrations and in far vision [gray, same as the gray histogram of (D), left] and a model with spherical aberrations in near vision (orange, focus proximity = 2.5 D, SA = 0.030 μm).
Fig. 7.
Fig. 7.. MTF radial profiles of the mouse eye model, simulated on-axis at a wavelength of 678 nm.
Comparison with the results of de la Cera and colleagues (43) is made for a 1.5-mm pupil diameter, specifically from Fig. 4, line “mouse with defocus (1.5 mm).” Moreover, the profile for a 1.4-mm pupil is shown, which corresponds to the pupil size of interest in the current study.

Similar articles

References

    1. Del Águila-Carrasco A. J., Kruger P. B., Lara F., López-Gil N., Aberrations and accommodation. Clin. Exp. Optom. 103, 95–103 (2020). - PMC - PubMed
    1. Kruger P. B., Mathews S., Aggarwala K. R., Sanchez N., Chromatic aberration and ocular focus: Fincham revisited. Vision Res. 33, 1397–1411 (1993). - PubMed
    1. Wilson B. J., Decker K. E., Roorda A., Monochromatic aberrations provide an odd-error cue to focus direction. J. Opt. Soc. Am. A Opt. Image Sci. Vis. 19, 833–839 (2002). - PubMed
    1. Bernal-Molina P., Marín-Franch I., Del Águila-Carrasco A. J., Esteve-Taboada J. J., López-Gil N., Kruger P. B., Montés-Micó R., Human eyes do not need monochromatic aberrations for dynamic accommodation. Opthalmic. Physiol. Opt. 37, 602–609 (2017). - PMC - PubMed
    1. Cholewiak S. A., Love G. D., Banks M. S., Creating correct blur and its effect on accommodation. J. Vis. 18, 1 (2018). - PMC - PubMed

LinkOut - more resources