. 2025 Aug 8;11(32):eadv9650.
doi: 10.1126/sciadv.adv9650. Epub 2025 Aug 8.

A human NK cell progenitor that originates in the thymus and generates KIR+NKG2A- NK cells

Affiliations

A human NK cell progenitor that originates in the thymus and generates KIR+NKG2A- NK cells

Julian Reiß et al. Sci Adv. .

Abstract

KIR+NKG2A- natural killer (NK) cells have the unique ability to detect down-regulation of single HLA-I allotypes, frequently occurring in malignantly transformed and virus-infected cells. We have recently shown that circulating innate lymphoid cells 1 (cILC1s) have the potential to generate such KIR+NKG2A- NK cells, but their developmental origin was unknown. Here, we demonstrate that the development of cILC1 is thymus dependent and identify a putative progenitor of cILC1s in the thymus (thyILC1). Single-cell RNA sequencing analysis revealed a close relationship of thyILC1s to CD34+ double-negative thymocytes. Both generated comparable NK cell frequencies, while only thyILC1s could be efficiently differentiated into KIR+NKG2A- NK cells. Last, patients with FOXN1 haploinsufficiency, showing congenital thymic hypoplasia, exhibited a profound deficiency of cILC1s but not cILC2s and cILC3s, demonstrating their specific thymus dependency. Together, the data suggest that thyILC1s are the source of a thymus-dependent NK cell differentiation pathway that promotes generation of KIR+NKG2A- NK cells.


Figures
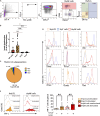
Fig. 1.
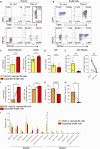
Fig. 1.. Human thyILC1s are the predominant innate lymphocytes subset and show a unique phenotype compared to thymic mature CD4+ T cells and NK cells.
Thymocytes were isolated from fresh human postnatal thymi (PNT) (47) from pediatric patients in the need for cardiac surgery (n = 22; mean age, 6 months). Thymocytes were stained and analyzed via flow cytometry. (A) Exemplary gating strategy to identify NK cells (linCD94+), thyILC1s (CD117CRTH2), thyILC2s (CD117+/−CRTH2+), and thyILC3s (CD117+CRTH2) in human PNT samples. (B) Bar graph showing the frequencies of NK cells (red), ILC1 (orange), ILC2 (green), and ILC3 (blue) from all thymocytes. (C) Pie chart displaying the mean frequency of thyILC1s (orange), thyILC2s (green), and thyILC3s (blue). (D) Representative histograms for T cell, NK cell, or ILC surface receptors for thyILC1s (yellow), thyNK cells (red), and thyCD4+ T cells (blue). (E) Representative histograms and bar graphs showing IFN-γ expression after 16-hour interleukine (IL) stimulation between thyILC1s (orange) and thyNK cells (red) compared to unstimulated controls and isotype controls (n = 10). Anti-CD11c antibody was added to the previously described lineage cocktail (7, 46) for all plots, later also −CD4, −CD8 to ensure the exclusion of T cell stages, except for (D). The height of the bars represents the means ± SEM. Levels of significance were calculated with a Friedman test and Dunn’s multiple comparison (B) or with a Wilcoxon test between the stimulated and unstimulated condition (E), *P < 0.05, **P < 0.01, ***P < 0.001, and ****P < 0.0001. Forward scatter area (FSC-A); side scatter area (SSC-A).
Fig. 2.
Fig. 2.. ThyILC1s show NKP potential to differentiate into KIR+ NKG2A NK cells.
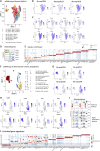
ThyILC1s and thyNK cells were flow cytometrically sorted and cultivated in vitro on OP9-DLL1 under NK cell differentiation supporting conditions (IL-2, IL-7, IL-15, SCF, and Flt3-L). After 14 days, the generated cells were analyzed for NK cell–specific surface receptors. Exemplary dot plots show the expression of CD94 against CD56 (top) and NKG2A against KIR-Mix (comprising antibodies for KIR2DL1/S1, KIR3DL1, and KIR2DL2/L3/S2) ex vivo (0 days) and after in vitro cultivation (14 days) of (A) thyILC1s and (B) thyNK cells. Bar graphs showing the frequencies of (C) CD94+NKG2A+ and CD56+ cells, (D) total KIR expression on total NK cells, and (E) KIR+NKG2A NK cells of the thyILC1-derived NK cells (yellow bar) and expanded thyNK cells (red bar) (n = 6 to 10). (F to H) KIR+ thyILC1s were specifically excluded by cell sorting. (F) Bar graphs showing the frequency of CD94/NKG2A+ and CD56+ cells in KIR thyILC1-derived NK cells (orange) and expanded thy NK cells (red) as well as the frequency of (G) total KIR+ and (H) KIR+NKG2A cells. (I) Dissection of the KIR repertoire of the thyILC1-derived NK cells (yellow bar) and expanded thyNK cells (red bar) analyzing the major inhibitory receptors KIR2DL1, KIR2DL2, KIR2DL3, KIR3DL1 +/−NKG2A (n = 6). Data were generated from ≥3 independent experiments and ≥3 different donors (n = 6 to 12). The height of the bars represents the means ± SEM. Levels of significance were calculated with a Wilcoxon test, *P < 0.05, **P < 0.01.
Fig. 3.
Fig. 3.. ThyILC1s differentiate into functional NK cells.
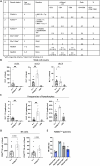
Cells were cultivated as described in Fig. 2 and effector functions analyzed against the HLA class I–deficient cell line K562. (A) Exemplary dot plots showing the granule mobilization marker CD107a expression of thyILC1-derived NK cells after 5 hours of exposure to the HLA-class I–deficient cell line K562 in a 1:1 effector target ratio. Bar graphs showing CD107a expression with (+) or without (−) K562 for thyILC1-derived NK cells (yellow bar, n = 10) compared to expanded thyNK cells (red bar, n = 12) and specific target cell lysis measured by a CFSE/PI-based cytotoxicity assay, shown in a bar graph for thyILC1-derived NK cells (yellow) and expanded thyNK cells (red) (n = 4). (B) Bar graphs showing the intracellular production of IFN-γ and TNF-α for thyILC1-derived NK cells (yellow bar, n = 7) compared to expanded thyNK cells (red bar, n = 10). Data were generated from at least three independent experiments with at least three different donors (n = 6 to 12). The height of the bars represents the means ± SEM. Levels of significance were calculated with a Wilcoxon test, *P < 0.05, **P < 0.01.
Fig. 4.
Fig. 4.. ThyILC1s are a phenotypically and transcriptionally distinct subset within the human thymus.
(A) Exemplary gating strategy to identify the frequencies of thyILC1s with different thymic T cell progenitor and committed stages. Lin cells were separated according to their CD3 surface expression. Lin CD3+ T cells were categorized into three distinct groups: late DPs (CD4+CD8+), single-positive CD4+ (CD4 SP), and single-positive CD8+ (CD8 SP) T cells. In contrast, LinCD3 cells were further divided into CD34+ double-negative (DN1-3) cells. Within the LinCD3CD34 thymocyte population, two subsets were identified: ISPs (CD4+CD8) and early DPs (CD4+CD8+). To ultimately identify thyILC1s, LinCD3CD34CD4CD8 cells were further defined as CD94CD127+CD117CRTH2. (B) Frequencies of the defined thymocyte subsets in a bar chart (n = 6). (C) Unbiased PCA of bulk RNA-seq data from flow cytometrically sorted ISPs (blue), DN3s (light blue), thyILC1s (yellow), thyNK cells (red), and thy CD4+ SP T cells (dark blue). (D) Heatmap of the top 100 differentially expressed genes between ISPs (blue) and DN3s (light blue) including CD4+ SPs T cells (dark blue), thyNK cells (red), and thyILC1s (yellow) (n = 2 to 3). (E) Four-way plot of bulk RNA-seq data from thyILC1s, DNs and ISPs (n = 3). (F) Violin plots of the normalized read counts of selected NK cell and ILC related genes from DN3 and thyILC1 (n = 3). The height of the bars represents the means ± SEM. The levels of significance were calculated with a nonparametric analysis of variance (ANOVA) (Kruskal-Wallis Test) with multiple comparison posttest between all populations (B), *P < 0.05, **P < 0.01, and ****P < 0.0001.
Fig. 5.
Fig. 5.. thyILC1 express the preTCRα chain without rearranged TCRβ chains.
For the gating, please read the legend of Fig. 4. (A) Violin plots of the normalized read counts of selected T cell development–related genes for DN3, thyILC1, thyNK cells, and CD4+ SP T cells (n = 2 to 3). (B) Representative dot plots and quantification in a bar chart for extracellular (top) and intracellular (bottom) expression of the TCR constant β1 (TCRCβ1) chain from the (Fig. 4A) defined populations (T cell stages and thyILC1s, n = 6). (C) Bar charts of the normalized read counts of total T cell receptor beta variable (TRBV) and T cell receptor alpha variable (TRAV) chain genes from bulk DESeq2 normalized RNA-seq data of DN3, thyILC1s, ISPs, and CD4+ SP T cells (n = 2 to 3). The height of the bars represents the means ± SEM. The levels of significance were calculated with a nonparametric ANOVA (Kruskal-Wallis Test) with multiple comparison posttest with thyILC1s compared all other cells (C), *P < 0.05.
Fig. 6.
Fig. 6.. ThyILC1s show NK cell but no T cell differentiation potential.
DN thymocytes (CD34+) and thyILC1s were flow cytometrically sorted and cultivated in parallel in vitro on OP9-DLL1 under either T cell [IL-7 and Flt3-L, (A and B)] or NK cell differentiation supporting cytokines (Fig. 2), (C to E) for 14 days (n = 3 to 4). The cells were flow cytometrically analyzed. (A) Representative dot plots showing FSC-A and SSC-A for thyDN-derived cells (top) and thyILC1-derived cells (bottom). ThyDN-derived cells were further gated for CD4 and CD8 expression. (B) Representative dot plots for TCRαβ and TCRCβ1 expression of two thyDN-derived populations: CD4+CD8 ISP–like and CD4+CD8+ DP–like are shown. Bar graphs showing the expression TCRCβ1 within CD4+CD8 ISP–like and CD4+CD8+ DP–like cells (n = 4). (C) Representative dot plots showing NKG2A against KIR-Mix (comprising antibodies for KIR2DL1/S1, KIR3DL1, and KIR2DL2/L3/S2) for thyILC1- and DN-derived cells (3000 events displayed). NK cells were defined as expressing either NKG2A or KIR or both. (D) Bar graphs showing the frequency of generated NK cells and NK cell subsets (KIRNKG2A+, KIR+NKG2A+, and KIR+NKG2A) from thyILC1s (yellow bar) or DNs (gray bar). (E) The functionality of the generated cells was analyzed via the HLA class I–deficient cell line K562. Bar charts of surface CD107a expression, intracellular IFN-γ and TNF-α with (+) or without (−) K562 for thyILC1-derived NK cells (yellow bars) in comparison to DN-derived NK cells (gray bars). The height of the bars represents the mean. Each dot represents a different donor. The lines represent the levels of an individual donor for each NK cell population (C). Levels of significance were calculated with a Wilcoxon test; for (E), statistics were calculated between the two groups with added K562 (+), *P < 0.05.
Fig. 7.
Fig. 7.. Single-cell transcriptional analysis distinguishes thyILC1s from NK cells and reveals similarities to DN thymocytes.
Thymocytes were isolated from thymic samples (n = 3) and flow cytometrically sorted on three populations: 1) ILCs and NK cells (LinCD3CD1aCD34CD4CD8CD127+/-CD94+/− cells), 2) early CD3 committed T cell stages (LinCD3CD34CD4−/+CD8+/−), and 3) DNs (LinCD3CD34+) with subsequent AbSeq staining and scRNA-seq analysis. (A) UMAP visualization of the 1) population comprising thyILC and NK cells selectively with color coding of clusters 0 to 8. Feature plots showing (B) CD94, CD127, and CD16 surface expression determined by AbSeq antibodies and (C) the gene expression of selected genes: IL7R, PTCRA, NOTCH3, RAG2, KLRD1, KLRC1, FCGR3A, and SELL. (D) Violin plots showing GZMK, GZMB, RAG2, RAG1, PTCRA, and CD3D expression for each cluster. (E) Dot plot showing the top 10 enriched genes within each cluster. (F) UMAP visualization of all three sorted CD3 thymic populations color coded by clusters 0 to 11. (G) Feature plots showing CD94, CD4, and CD56 surface expression determined by AbSeq antibodies and (H) expression of selected genes (EOMES, PTCRA, CD8A, MKI67, CD34, NOTCH3, PCNA, and KLRD1) to identify the different thymocyte populations. (I) Violin plots showing CD4, NCAM1, KLRD1, CD34, SOX4, NOTCH3, IL7R, ADA, RAG2, and RAG1 expression for each cluster. (J) Dot plot showing the top 10 enriched genes for each identified cluster.
Fig. 8.
Fig. 8.. cILC1s are significantly decreased in patients with known inborn thymic defects.
Blood from pediatric patients with FOXN1het (n = 3) and 22q11.2del with congenital athymia, also known as cDG (n = 2) was analyzed for the abundance of cILC1, cILC2, cILC3, and NK cells and compared to published reference values of cILC1-3 of age-matched children between the age 0 and 1 (23). (A) Summary table that categorizes the patients with respect to the genetic defects, age, and laboratory parameters. Bar graphs showing (B) total cell count (per microliter of blood) and (C) frequencies for cILC1s, cILC2s, and cILC3s in FOXN1het (n = 3) and patients with cDG (n = 2) compared to age-matched controls (n = 15). (D) Bar graphs showing total cell counts (per microliter of blood) for CD56dim and CD56bright NK cells from patients with FOXN1het (n = 3) in comparison to age-matched healthy controls (n = 15). (E) Bar graphs showing the frequencies of NK cell subsets based on NKG2A and KIR expression in patients with FOXN1het (n = 3). The height of the bars represents the means ± SEM. Levels of significance were calculated between the healthy cohort and the patients with FOXN1het a Wilcoxon test. Because of the small sample size, no statistical tests could be calculated with the patients with cDG, *P < 0.05, **P < 0.01.

References

    1. Hazenberg M. D., Spits H., Human innate lymphoid cells. Blood 124, 700–709 (2014). - PubMed
    1. Vivier E., Artis D., Colonna M., Diefenbach A., Di Santo J. P., Eberl G., Koyasu S., Locksley R. M., McKenzie A. N. J., Mebius R. E., Powrie F., Spits H., Innate lymphoid cells: 10 Years on. Cell 174, 1054–1066 (2018). - PubMed
    1. Bennstein S. B., Uhrberg M., Circulating innate lymphoid cells (cILCs): Unconventional lymphocytes with hidden talents. J. Allergy Clin. Immunol. 154, 523–536 (2024). - PubMed
    1. Mjösberg J. M., Trifari S., Crellin N. K., Peters C. P., van Drunen C. M., Piet B., Fokkens W. J., Cupedo T., Spits H., Human IL-25- and IL-33-responsive type 2 innate lymphoid cells are defined by expression of CRTH2 and CD161. Nat. Immunol. 12, 1055–1062 (2011). - PubMed
    1. Bennstein S. B., Scherenschlich N., Weinhold S., Manser A. R., Noll A., Raba K., Kögler G., Walter L., Uhrberg M., Transcriptional and functional characterization of neonatal circulating innate lymphoid cells. Stem Cells Transl. Med. 10, 867–882 (2021). - PMC - PubMed

MeSH terms

Substances