. 2025 Jul 31:86:103797.
doi: 10.1016/j.redox.2025.103797. Online ahead of print.

Oxidative modulation of Piezo1 channels

Affiliations

Oxidative modulation of Piezo1 channels

N Novosolova et al. Redox Biol. .

Abstract

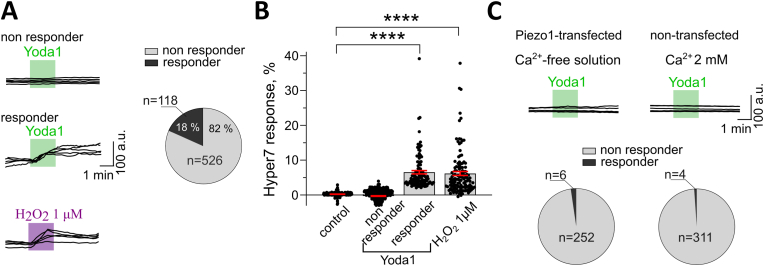
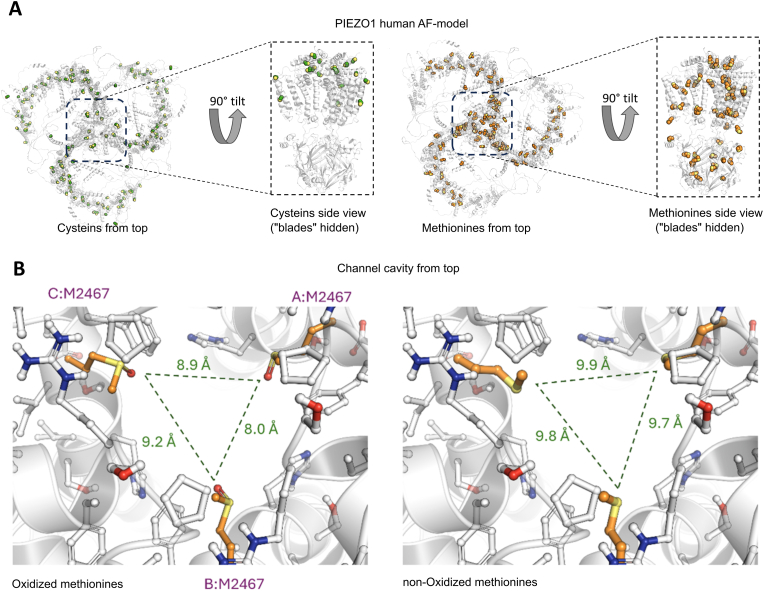
Emerging evidence suggests that mechanosensitive Piezo1 channels play a role in the pathomechanism of various disorders. However, the mechanisms by which accumulating pathologies regulate Piezo1 activation remain unclear. Oxidative stress, a common feature of neurodegenerative diseases, is associated with generation of reactive oxygen species (ROS). While the dependence of Piezo1 channels on temperature, pH, and voltage has been well studied, the redox regulation of these highly mechanosensitive channels remains unknown. We investigated whether oxidative stress modulates the calcium permeability of Piezo1 channels using red blood cells (RBCs) and HEK293T cells transduced with Piezo1 as model systems. Additionally, using the selective H2O2 sensor HyPer7, we examined whether Piezo1 activation induces the generation of endogenous ROS. Using flow cytometry, Ca2+-imaging, patch clamp and microaspiration techniques we demonstrate that cell-permeable oxidants hydrogen peroxide (H2O2) and Chloramine-T, which specifically oxidize cysteines and methionines, inhibited Yoda1-induced activation of Piezo1 in both cell types. In contrast to Chloramine-T, the membrane-impermeable, cysteine-specific oxidant DTNB (5,5'-dithiobis-(2-nitrobenzoic acid)) also inhibited Piezo1, although its inhibitory effect was less pronounced. Mechanical sensitivity of Piezo1 was reduced by H2O2 also in RBCs. Scavenging antioxidants N-acetylcysteine and dithiothreitol decreased or eliminated the inhibitory action of H2O2 and Chloramine-T. However, overexpression of the antioxidant transcription factor Nrf2 (Nuclear factor erythroid 2-related factor 2) did not prevent the inhibitory effects of Chloramine-T, suggesting a membrane-delimited site of redox modulation. Notably, Piezo1 activation slightly increased endogenous H2O2 production. Our data suggest that the reduced activity of Piezo1 in the oxidative environment is determined by oxidation of both cysteines and methionines, which are enriched in intracellular domains, with methionines playing a predominant role. Given the role of Piezo1 channels in pathophysiology of numerous disorders, we propose that, under conditions associated with oxidative stress, redox modulation of these mechanosensors could be a significant factor contributing to disease pathology.

Keywords: Hydrogen peroxide; Mechanoreceptors; Oxidation; Oxidative stress; Piezo1 channel.


Conflict of interest statement

Declaration of competing interest The authors declare the following financial interests/persoslgnal relationships which may be considered as potential competing interests: Tarja Malm reports financial support was provided by Research Council of Finland. If there are other authors, they declare that they have no known competing financial interests or personal relationships that could have appeared to influence the work reported in this paper.

Figures

Image 1
Graphical abstract
Fig. 1
Fig. 1
H2O2 and Chloramine-T dose-dependently decrease the activity of Piezo1 channels in human RBCs: A, left: flow cytometry with peristaltic pump for time-lapse mode recording. A, middle, right: flow cytometry gating strategy used to identify human red blood cells (RBCs). Light scatter profile for cells based on forward scatter (FSC) and side scatter (SSC) (the region is set to discriminate between RBCs and debris). Singlet gating based on FSC vs. FSC-height (the region is set to discriminate cell doublets). Fluorescence has been detected in FITC channel as Fluo4 AM intensity. Graph showing representative RBC signal from the baseline (dark red) and during Yoda1 application (black). Combining above criteria, RBCs were reliably identified. B: flow cytometry time lapse recording view. The X-axis represents the time (seconds) from the beginning of sample acquisition. Yoda1 was added at 20s; the Y-axis represents the relative fluorescence of Fluo-4 AM. Note decrease in the level of Fluo-4 AM fluorescence after 20min pretreatment in 500 μM H2O2 (right record) compared to control (left record). C, left, middle: the time-course of the Yoda1-mediated Ca2+ responses (MFI) after 20 min pretreatment in 100 μM (left) and 500 μM (right) of H2O2 in comparison to control. Note the significant decrease in MFI after the pretreatment in 100 μM (left) and 500 μM (middle) of H2O2. C, right: bar graphs showing decrease in Ca2+ response after H2O2 pretreatment, % at 240 s of time course recorded in the presence of Yoda1 (5 μM) in comparison to control (H2O2 100 μM: 88.5 ± 1.8 %, n = 22, P < 0.001; H2O2 500 μM: 77.3 ± 3.4 %, n = 11, P < 0.01; n is the number of patients, paired sample t-test). D, left, middle: the time-course of the Yoda1-mediated Ca2+ responses after 20 min pretreatment in 100 μM (left) and 500 μM (middle) of Ch-T in comparison to control. Note significant decrease in MFI level. D, right: bar graphs showing decrease in Ca2+ response after Ch-T pretreatment (Ch-T 100 μM: 92.2 ± 2.4 %, n = 6, P < 0.05; Ch-T 500 μM: 82.3 ± 2.8 %, n = 8, P < 0.001; n is the number of patients, paired sample t-test). E left, middle: the time-course of the Yoda1-mediated Ca2+ response after 20 min pretreatment in NAC 1 mM (left) and NAC + H2O2 500 μM (middle) in comparison to control. E, right: bar graphs showing the level of inhibition (%) of Yoda1-mediated Ca2+ responses (H2O2 500 μM: 22.7 ± 3.4 %, n = 11, P < 0.01; NAC 1 mM: 4.5 ± 2.0 %, n = 10, P > 0.05; NAC 1 mM + H2O2 500 μM: 8.6 ± 2.6 %, n = 9, P < 0.05; n is the number of patients, paired sample t-test). Note, that NAC decreases the effect of H2O2 (middle) but did not fully prevent inhibition. Statistical analysis between bars was performed using MW test.
Fig. 2
Fig. 2
H2O2 and Chloramine-T decrease the activity of Piezo1in HEK293T cells: A: schematic presentation of Ca2+ imaging protocol with an example of paired Ca2+ transients after the activation of Piezo1 channel by Yoda1. B: scheme for the patch clamp set-up. C: representative Ca2+ transients with paired-pulse applications of 5 μM Yoda1. Ca2+ transients without (left) and after 10 min exposure to H2O2 (middle, 500 μM). Note the decrease in the second Yoda1-mediated response after the application of H2O2 500 μM compared to control traces. C, right: corresponding Ca2+ ratio during the presence of redox agent (control: 43.2 ± 1.1 %, n = 16, total cell count is 466; H2O2 100 μM: 40.6 ± 1.3 %, n = 7, P > 0.05, total cell count is 213; H2O2 500 μM: 23.8 ± 1.7 %, n = 10, P < 0.0001, total cell count is 213, n is the number of coverslips, MW test). D: representative Ca2+ transients after 10 min exposure to reducing agents in the presence of H2O2 (left: NAC 1 mM + H2O2 500 μM; middle: DTT 1 mM + H2O2 500 μM). D, right: corresponding Ca2+ ratio during the presence of reducing agents with H2O2 (NAC + H2O2: 47.8 ± 1.3 %, n = 6, P < 0.05, total cell count is 167; DTT + H2O2: 48.3 ± 1.5 %, n = 8, P < 0.05, total cell count is 124, n is the number of coverslips, MW test). E, left: representative Ca2+ transients without (left) and after 10 min exposure to Ch-T (middle, 100 μM). Note the decrease in the second Yoda1-mediated response after the application of 100 μM Ch-T. E, right: corresponding Ca2+ ratio during the presence of redox agent (Ch-T 10 μM: 44.2 ± 3.3 %, n = 7, P > 0.05, total cell count is 227; Ch-T 100 μM: 7.6 ± 1.5 %, n = 10, P < 0.0001, total cell count is 222, n is the number of coverslips, MW test). F: representative Ca2+ transients after 10 min exposure to reducing agents in the presence of Ch-T (left: NAC 1 mM + Ch-T 100 μM; middle: DTT 1 mM + Ch-T 100 μM). E, right: corresponding Ca2+ ratio in the presence of reducing agents and Ch-T (NAC + Ch-T: 49.9 ± 1.9 %, n = 6, P < 0.05, total cell count is 168; DTT + Ch-T: 49.02 ± 1.5 %, n = 6, P < 0.05, total cell count is 335, n is the number of coverslips, MW test). Note the ability of both the reducing agents to antagonize the impact of oxidants exposure on Piezo1 activity, presented in C, E. G. Yoda1-activated transmembrane current through Piezo1 channel in control and after exposure to H2O2 using patch clamp paired-pulse protocol. Note decrease in the current ratio after the exposure to H2O2 compared to control (control: 49.52 ± 3.8 %, n = 7; H2O2 500 μM: 11.50 ± 2.6 %, n = 10, P < 0.001, n is the number of cells, MW test).
Fig. 3
Fig. 3
Activation of Piezo1 channels lead to endogenous generation of ROS in Piezo1HEK293T cells: A: example traces of HyPer7 fluorescence reporting generation of endogenous H2O2 in a fraction of cells after application of Yoda1. Notice comparable HyPer7 response induced by application of 1 mM H2O2. Pie diagram shows that 18 % (118 out from 644) of all cells responded after activation of Piezo1 by Yoda1. B: corresponding bar graphs showing changes in the HyPer7 fluorescence after application of Yoda1 and H2O2 (control: 0.21 ± 0.03 %, n = 210; non-responder Yoda1: 0.3 ± 0.1 %, n = 511; responder Yoda1: 6.52 ± 0.5 %, P < 0.0001, n = 118; H2O2 1 mM: 6.16 ± 0.6 %, n = 122; P < 0.0001, MW test, n number of cells). C, upper: example traces showing no changes in HyPer7 fluorescence in Ca2+-free solution in Piezo1HEK293T cells and similar lack of responses in non-transfected HEK293T and corresponding pie diagrams.
Fig. 4
Fig. 4
Microaspiration experiments with RBCs: A. scheme showing the process of RBC aspiration by glass pipette and RBC's fluorescence after mechanical stimulation. B: bar graphs showing the percentage of responded cells during mechanical stimulation in control and under the application of oxidants. Note dose dependant decrease in the number of responded cells with increasing concentration of oxidants. C. Fluorescent Ca2+ signals (F-Fo/Fo) corresponding to channel activation. C, left: experiments with H2O2 (control 0.16 ± 0.01 %, n = 92; H2O2 10 μM 0.15 ± 0.01 %, n = 88, P > 0.05; H2O2 100 μM 0.12 ± 0.007 %, n = 71, P < 0.05, MW test, n is number of cells). C, right: experiments with Ch-T (control 0.25 ± 0.01 %, n = 156; Ch-T 100 μM 0.18 ± 0.02 %, n = 99, P < 0.001; Ch-T 500 μM: 0.09 ± 0.004 %, n = 65, P < 0.001, MW test, n is number of cells).
Fig. 5
Fig. 5
Piezo1 human AF-model: A, left: cysteines in green from outside part of the channel (left) and cysteines in sideview of the channel (channel blades are hidden). A, right: methionines in orange from outside part of the channel (left) and methionines in sideview of the channel (channel blades are hidden). Note abandon distribution of methionines throughout the whole channel but cysteines mostly from outside membrane side. B:methionines M2467 from the intracellular part of the channel in oxidized state (left) and non-oxidized state (right). Note, decrease in the pore size when methionines are oxidized.

Similar articles

References

    1. Coste B., Mathur J., Schmidt M., Earley T.J., Ranade S., Petrus M.J., Dubin A.E., Patapoutian A. Piezo1 and Piezo2 are essential components of distinct mechanically activated cation channels. Science. 1979;330:55–60. doi: 10.1126/science.1193270. 2010. - DOI - PMC - PubMed
    1. Evtugina N.G., Peshkova A.D., Khabirova A.I., Andrianova I.A., Abdullayeva S., Ayombil F., Shepeliuk T., Grishchuk E.L., Ataullakhanov F.I., Litvinov R.I., Weisel J.W. Activation of Piezo1 channels in compressed red blood cells augments platelet-driven contraction of blood clots. J. Thromb. Haemostasis. 2023;21:2418–2429. doi: 10.1016/j.jtha.2023.05.022. - DOI - PMC - PubMed
    1. Jiang F., Yin K., Wu K., Zhang M., Wang S., Cheng H., Zhou Z., Xiao B. The mechanosensitive Piezo1 channel mediates heart mechano-chemo transduction. Nat. Commun. 2021;12:869. doi: 10.1038/s41467-021-21178-4. - DOI - PMC - PubMed
    1. Martins J.R., Penton D., Peyronnet R., Arhatte M., Moro C., Picard N., Kurt B., Patel A., Honoré E., Demolombe S. Piezo1-dependent regulation of urinary osmolarity. Pflugers Arch. 2016;468:1197–1206. doi: 10.1007/s00424-016-1811-z. - DOI - PubMed
    1. Zeng W.-Z., Marshall K.L., Min S., Daou I., Chapleau M.W., Abboud F.M., Liberles S.D., Patapoutian A. PIEZOs mediate neuronal sensing of blood pressure and the baroreceptor reflex. Science. 1979;362:464–467. doi: 10.1126/science.aau6324. 2018. - DOI - PMC - PubMed

LinkOut - more resources