. 2025 Aug 8;16(1):7316.
doi: 10.1038/s41467-025-61915-7.

Human cytomegalovirus induces neuronal gene expression through IE1 for viral maturation

Affiliations

Human cytomegalovirus induces neuronal gene expression through IE1 for viral maturation

Laurel E Kelnhofer-Millevolte et al. Nat Commun. .

Abstract

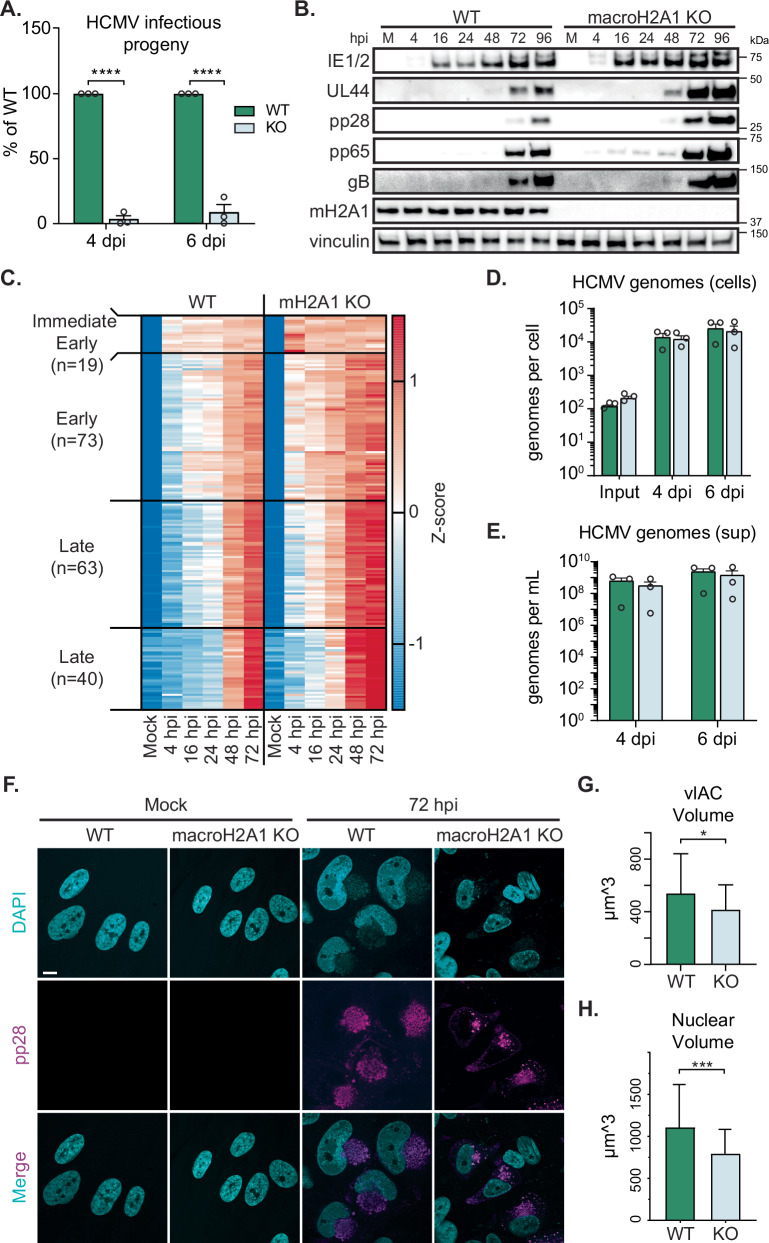
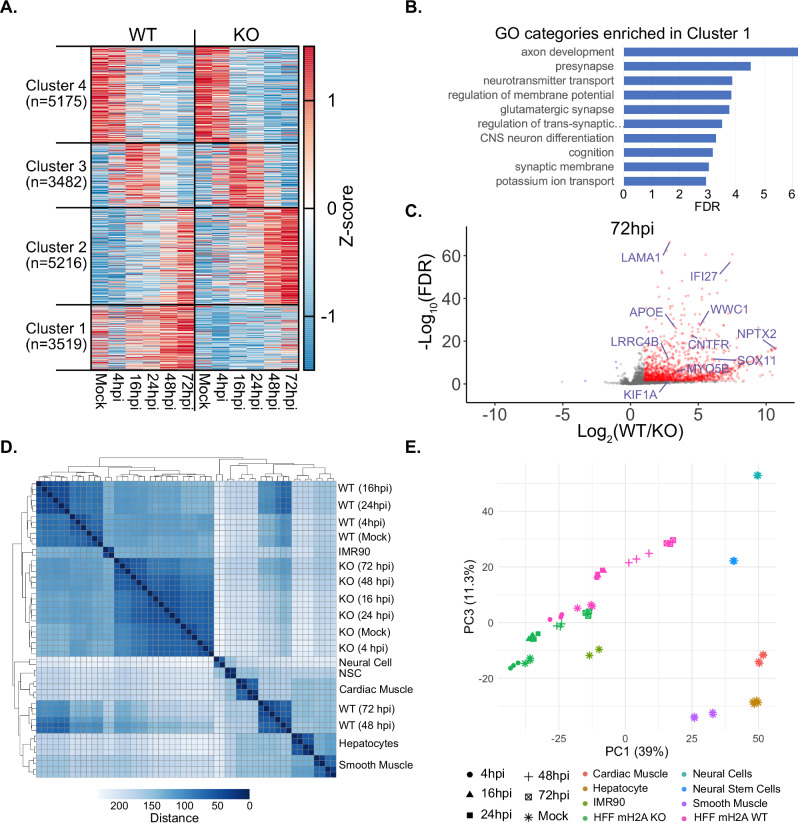
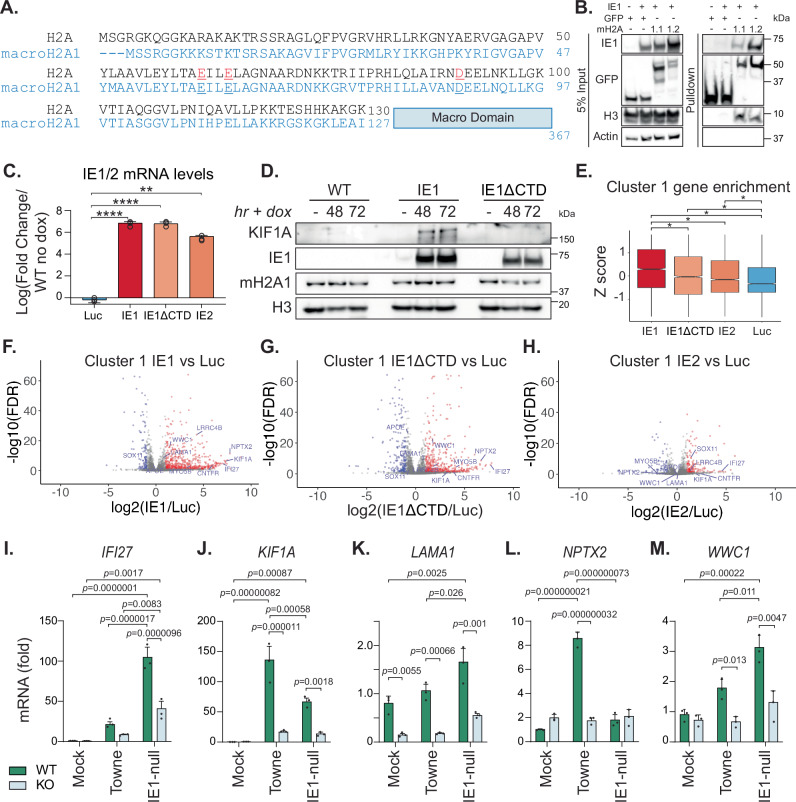
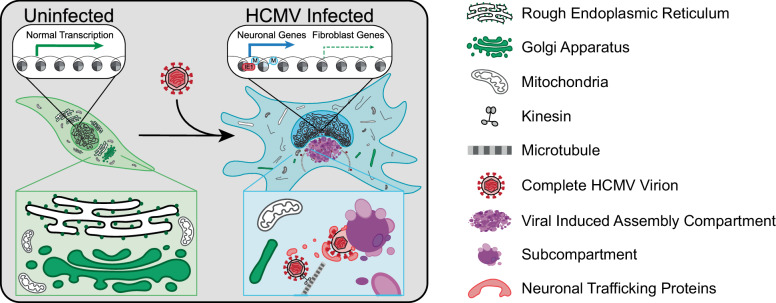
Viral invasion of the host cell causes some of the most dramatic changes in biology. Human cytomegalovirus (HCMV) extensively remodels host cells, altering nuclear shape and generating a cytoplasmic viral-induced assembly compartment (vIAC). How these striking morphology changes occur in the context of host gene regulation is still emerging. Histone variant macroH2A1 is both important for maintaining nuclear integrity and functions to promote herpes simplex virus infection. Therefore, we hypothesized it may also function in cytomegalovirus infection. Here, we discovered that macroH2A1 is necessary for HCMV-induced cellular reorganization and formation of infectious progeny. Using RNA-seq in infected cells, we find that while all viral genes are highly expressed in the absence of macroH2A1, many HCMV-induced host genes are not. Remarkably, hundreds of these HCMV-induced macroH2A1-dependent host genes are associated with a neuronal signature. Further, we find that HCMV immediate early protein, IE1, is both necessary and sufficient to induce these neuronal genes, providing a mechanism of activation. Together, our findings demonstrate that HCMV hijacks a dormant neuronal secretory pathway through chromatin manipulation for efficient virion maturation.


Conflict of interest statement

Competing interests: The authors declare no competing interests.

Figures

Fig. 1
Fig. 1. HCMV requires macroH2A1 for efficient production of infectious progeny, but not protein, RNA, or genome accumulation.
HCMV (A) Infectious progeny produced from HCMV infected WT and macroH2A1 KO HFF-T cells quantified by plaque assay at days post infection (dpi) as indicated. Viral yield is the percent yield compared to wild type, with errors bars representing SEM. **** at 4 hpi denotes p = 7.2 × 10−8 and at 6 hpi p = 1.1 × 10−7 by two-way ANOVA with follow up Šídák multiple comparisons test. n = 3 biological replicates. B Representative western blots of viral proteins in cells as in (A) during HCMV infection at hours post infection (hpi) compared to mock (M) as indicated. Vinculin is shown as loading control. C Heat map of viral genes measured by RNA sequencing at 4, 16, 24, 48, and 72 hpi compared to mock (M). n = 3 biological replicates. D Droplet digital PCR (ddPCR) quantification of HCMV genomes extracted from infected WT and macroH2A1 KO cells at 4 h (input), 4, and 6 dpi. Bar graphs show the mean with error bars indicating SEM. n = 3 biological replicates. No significance at any time point by two-way ANOVA with follow up Šídák multiple comparisons test. E ddPCR quantification of HCMV genomes released from cells as in (D) and isolated from supernatants (sups) after nuclease treatment, indicating encapsidated genomes. Error bars represent the SEM of three biological replicates. No significance at any time point by two way ANOVA with follow up Šídák multiple comparisons test. F Representative immunofluorescence images of WT and macroH2A1 KO cells during HCMV infection at mock and 72 hpi. DAPI is shown in cyan, and viral protein pp28 is shown in magenta. Scale bar represents 10 µm. G Quantification of the volume of viral induced assembly compartments (vIACs) measured by pp28 fluorescence. Bar graphs show mean with error bars indicating SEM. * denotes p = 2.12×10² by unpaired T-test with n = 42 in WT and n = 50 in KO. H Quantification of nuclear volume of HCMV-infected cells at 72 hpi. Bar graphs show mean with error bars indicating SEM. *** denotes p = 5.7×10⁻⁴ by unpaired T-test with n = 44 in WT and n = 49 in KO.
Fig. 2
Fig. 2. HCMV cellular remodeling, vIAC formation, and progeny virion composition are dependent on macroH2A1.
A Representative transmission electron microscopy (TEM) images of mock-treated WT and macroH2A1 KO HFF-T cells showing the uninfected state of the endoplasmic reticulum (ER). B Representative TEM images at 4 days post infection (dpi) with HCMV. C Representative TEM images of viral-induced assembly compartments (vIAC) at 4dpi as indicated. Below: Zooms with annotated versions to the right. Scale bars as indicated. D Quantification of vIAC subcompartment area. Violin plot depicts median, and upper, and lower quartiles as dotted lines. *** denotes p < 0.001 or p = 4.3×10⁻⁴ by Kolmogorov-Smirnov test with n = 143 for WT and n = 138 for KO. E Scatter plot of HCMV viral proteins identified by LC-MS in virion preparations from WT- and macroH2A1 KO-infected cells. Enriched proteins (fold change [FC] ≥ 1) in macroH2A1 KO virion preparations are shown as gray dots, while depleted proteins (FC ≤ −1) are highlighted in orange (n = 3 technical replicates), envelope proteins in red. The identified HCMV viral proteome was normalized to the major capsid protein (MCP, UL86), which exhibited consistent abundance across all conditions. See Sup Fig. 3 and Sup Data 1 for further details.
Fig. 3
Fig. 3. Host gene expression is altered upon loss of macroH2A1 during HCMV infection.
A K-means clustering (k = 4) of gene expression changes over 72 hours of infection shown as a heatmap. Z-scores were calculated for each gene from its normalized count across the time course of CMV infection for WT and macroH2A1 KO cells. B The -log10(FDR) value for enrichment of neuronal GO categories in Cluster 1. C Volcano plot where the Log2(Fold Change) for WT vs. macroH2A1 KO is plotted against -log10(FDR) for genes in Cluster 1. Genes with Log2(Fold Change) > 1 and FDR ≤ 0.05 are marked in red. Neuronal genes selected for further characterization are labeled in blue. D Matrix of Euclidean distance between normalized expression profiles of CMV infection time course for WT and macroH2A1 KO, and other cell types. Gene expression datasets for other cell types were obtained from ENCODE. E PCA plot showing PC1 and PC3 for the same expression profiles plotted in (D).
Fig. 4
Fig. 4. Successful HCMV maturation requires induction of dormant neuronal proteins.
A Schematic of targeted siRNA screen. (B) RT-qPCR quantification of RNA levels of target genes during HCMV infection. These genes include APOE, a lipoprotein associated with Alzheimer’s disease and synaptic vesicle release,; CNTFR, a ciliary neurotrophic factor receptor that supports motor neuron axons; DOC2B a calcium sensor that promotes synaptic vesicle release; ERC1, a cellular scaffolding protein; IFI27, an interferon-induced gene expressed in the cerebellum in response to viral CNS infection; KIF1A, a neuronal kinesin; LAMA1, a laminin essential for neurite growth,; LRRC4B, a transmembrane protein that regulates synapse formation; MYO5B, a myosin associated with polarity and axon development; NPTX2 (formerly NARP), a small molecule released in excitatory synapses; SOX11, a transcription factor associated with neuron development; and WWC1, a synaptic scaffolding protein. Knockdown of each gene is normalized to its expression in cells treated with the non-targeting control (NC) at 4 dpi. Bar graphs show mean with error bars indicating SEM. n = 3 biological replicates. P-values by unpaired t-test as follows: APOE**** p = 7.4×10⁻⁵, CNTFR* p = 1.14×10⁻³, ERC1* p = 3.83×10⁻², IFI27* p = 1.62×10⁻², KIF1A** p = 4.09×10⁻³, LRRC4B*** p = 9.3×10⁻⁴, MYO5B* p = 1.62×10⁻², NPTX2**** p = 1.5×10⁻⁵, SOX11* p = 3.80×10⁻², WWC1* p = 1.62×10⁻². C Representative western blot of siRNA knockdown of KIF1A in WT cells during HCMV infection at 4 dpi compared to mock (M). Asterisk indicates a non-specific band. Tubulin is shown as loading control and pp28 is shown as infection control. D Quantification of plaque area produced from supernatant harvested from cells treated with siRNA indicated. Those that reach statistical significance are bolded. Bar graphs show mean with error bars indicating SEM. * denotes p < 0.05, ** denotes p < 0.01, *** denotes p < 0.001 by one way ANOVA with follow up Dunnett’s test as follows: NC/IFI27*** p = 9.5×10⁻⁴, NC/KIF1A* p = 2.52×10⁻², NC/LAMA1* p = 4.3×10⁻², NC/NPTX2** p = 8.12×10⁻³, NC/WWC1*** p = 3.2×10⁻⁴, and n values: NC n = 652, APOE n = 593, CNTFR n = 863, DOC2B n = 599, ERC1 n = 591, IFI27 n = 332, KIF1A n = 455, LAMA1 n = 478, LRRC4B n = 546, MYO5B n = 408, NPTX2 n = 514, SOX11 n = 651, WWC1 n = 459. E Representative images of plaque sizes for those with significant differences as indicated. Yellow dashed line frames plaque example. Scale bar indicates 150 µm.
Fig. 5
Fig. 5. HCMV IE1 is necessary and sufficient to drive expression of dormant macroH2A1-dependent genes.
A H2A and macroH2A1 homology. Residues that facilitate binding of IE1 are in red in H2A and underlined in macroH2A1. B Co-immunoprecipitation western blot of IE1 and macroH2A1 in 293 T cells co-transfected with IE1 and GFP, macroH2A1.1-GFP, or macroH2A1.2-GFP or GFP alone as indicated. C RT-qPCR quantification of levels of IE1/2 in doxycycline (dox) inducible cell lines at 48 h normalized to luciferase (Luc). Bar graph shows mean, error bars indicate SEM. P values by one way ANOVA with follow up Dunnett’s test as follows: Luc/IE1*** p = 4.4 × 10−8, Luc/dCTD**** p = 4.6×10⁻⁸, and Luc/IE2** p = 2.4×10⁻⁷. n = 3 biological replicates. D Representative western blot of proteins in cell types upon dox addition as indicated. H3 is shown as a loading control. E Z-scores for each gene from its normalized count across cells expressing IE1, IE1ΔCTD, IE2, Luciferase, and control cells. The distribution of Z-scores for genes in cluster 1 (from Fig. 3A) are shown as a boxplot where the lower and upper hinges correspond to the first and third quartiles. Pairwise comparisons that yield p < 0.05 by Wilcoxon Rank Sum test are indicated by asterisk (*). P-values were adjusted for multiple comparisons using Benjamini & Hochberg correction. See Methods for more details. F Volcano plot where the Log2(Fold Change) for IE1 vs. Luciferase ectopic expression is plotted against -log10(FDR). Genes with Log2(Fold Change)>1 and FDR ≤ 0.05 are in red. Genes with Log2(Fold Change)<−1 and FDR ≤ 0.05 are in blue. Neuronal genes selected for further characterization are labeled in blue. G Same as (F) for IE1ΔCTD vs. Luciferase. H Same as (F) for IE2 vs. Luciferase. I RT-qPCR quantification of RNA levels of IFI27 in WT and macroH2A1 KO cells infected with HCMV Towne or IE1-null (CR208), normalized to 18S rRNA. Bar graph shows mean with error bars indicating SEM. N = 3 biological replicates. P values by two-way ANOVA with follow up Šídák multiple comparisons test as indicated. J Same as (I) for KIF1A. K Same as (I) for LAMA1. L Same as (I) for NPTX2. M Same as (I) for WWC1.
Fig. 6
Fig. 6. Model schematic.
HCMV-infected cells upregulate neuronal genes, through IE1, and these genes are required by the virus for proper cellular remodeling, formation of the viral assembly compartment, and viral maturation to promote viral spread.

Update of

References

    1. Cannon, M. J., Schmid, D. S. & Hyde, T. B. Review of cytomegalovirus seroprevalence and demographic characteristics associated with infection. Rev. Méd. Virol.20, 202–213 (2010). - PubMed
    1. Fowler, K. et al. A systematic literature review of the global seroprevalence of cytomegalovirus: possible implications for treatment, screening, and vaccine development. BMC Public Heal22, 1659 (2022). - PMC - PubMed
    1. Zanghellini, F., Boppana, S. B., Emery, V. C., Griffiths, P. D. & Pass, R. F. Asymptomatic Primary Cytomegalovirus Infection: Virologic and Immunologic Features. J. Infect. Dis.180, 702–707 (1999). - PubMed
    1. Manicklal, S., Emery, V. C., Lazzarotto, T., Boppana, S. B. & Gupta, R. K. The “Silent” Global Burden of Congenital Cytomegalovirus. Clin. Microbiol Rev.26, 86–102 (2013). - PMC - PubMed
    1. Azevedo, L. S. et al. Cytomegalovirus infection in transplant recipients. Clinics70, 515–523 (2015). - PMC - PubMed

MeSH terms