. 2025 Aug 8;16(1):7340.
doi: 10.1038/s41467-025-61974-w.

Epigenetic modulation with nanosatellite triggers tumoricidal immunity for hepatocellular carcinoma treatment

Affiliations

Epigenetic modulation with nanosatellite triggers tumoricidal immunity for hepatocellular carcinoma treatment

Ying Qu et al. Nat Commun. .

Abstract

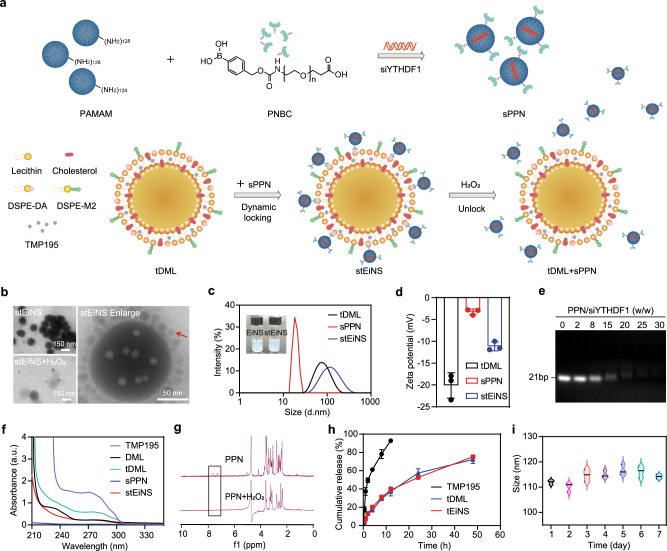
Epi-immunotherapy appears promising for hepatocellular carcinoma (HCC) treatment, but immunosuppressive macrophages limit the capacity of epigenetic regulation to activate T cell-mediated tumoricidal immunity. Here we report an epi-immune nanosatellite (stEiNS) that co-delivers siRNA targeting the YTH N6-methyladenosine RNA binding protein 1 (YTHDF1) alongside the histone deacetylase IIa inhibitor TMP195, enabling epigenetic reprogramming of HCC tumor cells and M2 macrophages to enhance the immunotherapeutic response. stEiNS assembles size-mismatched nanoparticles via dynamic locks in a satellite-like structure, enabling deep tissue penetration. Knockdown of YTHDF1 by stEiNS in HCC cells, along with stEiNS-driven antitumor macrophage phenotype induction, intensifies macrophages-cytotoxic T lymphocytes interactions with tumor cells. stEiNS suppresses TNF/NF-κB signaling in tumor cells to inhibit CCL2-driven recruitment of myeloid-derived suppressor cells while activating the IFNγ/STAT1 pathway in M2-phenotype macrophages to promote their polarization toward an M1 phenotype. Collectively, these effects trigger robust tumoricidal immunity, leading to efficient tumor eradication, as validated in patient-derived tumor organoids, orthotopic HCC models, and recurrence models. In summary, we establish a dual-targeting stEiNS with promising epi-immunotherapeutic potential against advanced HCC and diverse malignancies.


Conflict of interest statement

Competing interests: The authors declare no competing interests.

Figures

Fig. 1
Fig. 1. Bioinformatic analysis of YTHDF1 expression in HCC tumors and a schematic illustration of engineered stEiNS working for HCC tumor progress and postresection tumor relapse.
a A boxplot of YTHDF1 expression in HCC patients and healthy people isolated from TCGA and Genotype-Tissue Expression determined by Gene Expression Profiling Interactive Analysis. The data were transformed as log2(TPM  +  1). Normal: maxima 4.7099, minima 2.0076, center 3.4694; Tumor: maxima 5.6854, minima 2.3564, center 3.9079. Color key: red, HCC tissues; blue, normal liver tissues. YTHDF1 displays negative associations with (b) disease-free survival in HCC patients. c The prognostic significance of YTHDF1 in HCC patients. Number at risk refers to the number of patients in each experimental group who remain event-free at the specified time points and are still at risk of reaching the study endpoint. d The correlation between YTHDF1 and immune score. e YTHDF1 expression at the mRNA and protein levels in Huh7 and Hepa1-6 cells, with hepatocytes freshly isolated from C57BL/6 mice serving as the control (n = 3 independent experiments). f Schematic illustration of the role of the dynamic locking stEiNS in HCC tumor, which regulates the epigenetic modifications of both tumor cells and M2Φs to enhance the effectiveness of immunotherapy against HCC. Data are expressed as mean ± SD and were determined using one-way analysis of variance (ANOVA) followed by Tukey’s multiple comparisons test. ****P < 0.0001.
Fig. 2
Fig. 2. Preparation and characterization of engineered stEiNS.
a schematic illustration of the preparation of dynamic-locking stEiNS. b Transmission electron microscopy imaging of stEiNS, enlarged stEiNS, and H2O2-treated stEiNS (n = 3 independent experiments). c Particle size changes of tDML, sPPN, and stEiNS determined by dynamic light scattering (DLS) with the photographs of EiNS and stEiNS (n = 3 independent experiments). d Zeta potential alterations of tDML, sPPN, and stEiNS determined with DLS (n = 3 independent experiments). e Agarose gel electrophoresis of sPPN (n = 3 independent experiments). f UV absorption spectra of TMP195, DML, and tDML, sPPN, and stEiNS. g 1H NMR changes of PPN under an in vitro simulated tumor local high concentration H2O2 environment. h In vitro drug release profiles of free TMP195, tDML, and tEiNS (n = 3 independent experiments). (i) Storage stability of stEiNS in PBS at 4 °C. Data are expressed as mean ± SD.
Fig. 3
Fig. 3. The dual-targeting ability, tissue penetration, cellular uptake and retention capability of EiNS.
a, b Confocal images and (c) flow cytometric analysis illustrating the in vitro internalization of s-Cy3EiNS after 12 h of incubation with Huh7 and Hepa1-6 cells, with siYTHDF1 labeled with Cy3 (n = 3 independent experiments). Scale bar, 20 µm. d YTHDF1Cy3+ ratio in Huh7 and Hepa1-6 cells treated with various formulations (n = 3 independent experiments). e Mean fluorescence intensity (MFI) ratio of YTHDF1Cy3+ in Huh7 and Hepa1-6 cells across different treatment groups (n = 3 independent experiments). Confocal images showing subcellular localization in (f) Huh7 and (g) Hepa1-6 cells incubated with s-Cy3EiNS for 1, 3, and 6 h at 37 °C (n = 3 independent experiments). Nuclei were stained with DAPI (blue), endo/lysosomes with LysoTracker Green (green), and siYTHDF1 with Cy3 (red). h, i Quantitative co-localization analysis of S-Cy3 with endo/lysosomes labeled by LysoTracker Green (n = 3 independent experiments). j Schematic illustration of deep tumor penetration of s-Cy3EiNS in 3D tumorspheres. Created in BioRender. Y.Q. (2025) https://BioRender.com/r8jogdb. k Representative CLSM images showing enhanced penetration of sEiNS compared to Lipo/s in Huh7 and Hepa1-6 tumorspheres (n = 3 independent experiments). Scale bar, 100 µm. l The IVIS imaging and (m) fluorescence intensity quantification at various time points in mice with subcutaneous Hepa1-6 tumors (tumors marked with white circles, n = 3 mice per group). EiNS(-M2Φpep), EiNS without M2Φpep modification. Data are expressed as mean ± SD. Statistical significance was determined using one-way ANOVA followed by Tukey’s multiple comparisons test (d, e, h, i), or two-way ANOVA (m). *P < 0.05, **P < 0.01, ***P < 0.001, ****P < 0.0001.
Fig. 4
Fig. 4. Suppression of YTHDF1 in tumor cells triggered by sEiNS.
a YTHDF1 mRNA expression levels in Huh7 and Hepa1-6 cells following treatment with diverse nanomedicines (n = 3 independent experiments). b YTHDF1 protein expression levels in Huh7 and Hepa1-6 cells after exposure to various nanomedicines (n = 3 independent experiments). Cell viability of (c) Huh 7 and (d) Hepa1-6 cells assessed by MTT assay following treatment with various formulations (n = 3 independent experiments). e Representative images and (f) quantification of clonal assay in Huh7 and hepa1-6 cells with treatment of various formulations were presented (n = 3 independent experiments). g, h Apoptosis analysis and statistical evaluation of apoptosis rates in Huh7 and Hepa1-6 cells treated with sPPN, sEiNS, and Lipo/s for 24 h (n = 3 independent experiments). i Treatments of HCC patients-derived PDOs in different treatment groups (n = 3 independent experiments). Scale bar, 100 µm. Data are expressed as mean ± SD. Statistical significance was determined using one-way ANOVA followed by Tukey’s multiple comparisons test (a, f, g), or two-way ANOVA (c, d). *P < 0.05, **P < 0.01, ***P < 0.001, ****P < 0.0001.
Fig. 5
Fig. 5. Analysis of in vitro macrophage repolarization and antitumor efficacy.
a Confocal images (Scale bar, 15 µm) and (b) flow cytometry analysis depicting the uptake of FITC by RAW 264.7 cells using various delivery nanoparticles (n = 3 independent experiments). c FITC+ ratio in M2Φs treated with various formulations (n = 3 independent experiments). d Mean fluorescence intensity (MFI) ratio of FITC+ M2Φs across different treatment groups (n = 3 independent experiments). e Polarized RAW264.7 cells (M2-like phenotype) were treated with different formulations for 24 h, followed by flow cytometry analysis to determine the percentages of M1-like and M2-like macrophages (n = 3 independent experiments). f The ratio of M1-like/M2-like macrophages after treatment of varioius formulations (n = 3 independent experiments). g Phagocytic capacity of M2-polarized RAW264.7 cells pretreated with various formulations, assessed by flow cytometry and MTT assay in a coculture with GFP-labeled Hepa1-6 cells. Created in BioRender. Y.Q. (2025) https://BioRender.com/tait9j9. h Flow cytometry analysis of the phagocytic rate of M2-like RAW264.7 cells in a coculture system with GFP-labeled Hepa1-6 cells following incubation with different formulations (n = 3 independent experiments). i Differences in phagocytic rates of Hepa1-6 cells by RAW264.7 cells treated with different formulations (n = 3 independent experiments). j Hepa1-6 cell viability investigation using a coculture system of polarized M2-like RAW264.7 and GFP-labeled Hepa1-6 cells, incubated with different formulations (n = 6 independent experiments). k Co-culture of tEiNS-treated M2-like macrophages, Hepa1-6 cells, and isolated CD3+ T cells to assess CD8+ T cells activation. Created in BioRender. Y.Q. (2025) https://BioRender.com/tait9j9. l Representative scatter plots of flow cytometry data showing the percentage of GzmB+ and IFNγ+ cells within the CD8+ T cell population following co-culture with EiNS, tDL, tDML or tEiNS-treated M2-like macrophages, Hepa1-6 cells, and CD3+ T cells, as indicated (n = 3 independent experiments). m Quantitative results showing the numbers of GzmB+ and IFNγ+ cells as a percentage of the total CD8+ T cell population (n = 3 independent experiments). Data are expressed as mean ± SD and were determined using one-way ANOVA followed by Tukey’s multiple comparisons test. *P < 0.05, **P < 0.01, ***P < 0.001. ****P < 0.0001.
Fig. 6
Fig. 6. In vivo antitumor efficacy and immunotherapy efficacy analysis of stEiNS in orthotopic HCC model mice.
a Experimental scheme of the orthotopic Hepa1-6 model established in male C57BL/6 mice. Different formulations containing equivalent doses of siYTHDF1 (3 µg each) or/and TMP195 (10 mg/kg each) were intravenously (i.v.) administered via the tail vein. Created in BioRender. Y.Q. (2025) https://BioRender.com/9ze5vnk. b IVIS images of Luci+ Hepa1-6 tumor-bearing mice treated with diverse formulations. c B-ultrasound and H&E staining of mice livers in different groups (n = 3 independent experiments). d Survival analysis of mice in the indicated treatment groups (n = 6 mice per group). e IHC staining of YTHDF1 and MHC-I, and TUNEL staining in liver tumor sections from mice after indicated treatments, scale bar, 50 µm. f Flow cytometric analyses of the M1-like macrophages and M2-like macrophages after treatment with various formulations. Percentage of (g) M1-like phenotype (CD45+CD11b+F4/80+CD86+), (h) M2-like phenotype (CD45+CD11b+F4/80+CD206+), after treatment with different formulations (n = 5 independent experiments). i The ratio of M1-like/M2-like macrophages in vivo after treatment with different formulations (n = 5 independent experiments). j Percentage of CD8+T in CD3+T cells. Percentage of (k) GzmB+ T and (l) IFNγ+ in CD8+T cells (n = 5 independent experiments). m Heatmap of IL-6, TNF-α, and IFNγ expression profiles in HCC tumor tissues (n = 5 independent experiments). Data are expressed as mean ± SD and were determined using one-way ANOVA followed by Tukey’s multiple comparisons test. ns P ≥ 0.05, *P < 0.05, **P < 0.01, ***P < 0.001. ****P < 0.0001.
Fig. 7
Fig. 7. stEiNS inhibits HCC postoperative recurrence in vivo and augments immunotherapy efficacy.
a Schematic representation of the Hepa1-6 postoperative recurrence model in male C57BL/6 mice. Ten days after subcutaneous tumor implantation, the tumor was surgically resected to establish the recurrence model. Different formulations containing equivalent doses of siYTHDF1 (3 µg each) or/and TMP195 (10 mg/kg each) were administered intravenously via the tail vein. Created in BioRender. Y.Q. (2025) https://BioRender.com/951b31b. b Tumor growth curves. c Relative tumor weight with photographs of the excised tumors (n = 5 independent experiments). The percentages of (d) CD8+ TEM (CD45+CD3+CD8+CD44+CD62L-) and (e) CD8+ TCM (CD45+CD3+CD8+CD44+CD62L+) gated from total CD8+ T cells in the spleen (n = 5 independent experiments). f IHC staining of Ki67 in HCC tumor tissues after various treatments. Scale bar, 50 µm. g Schema of experimental design of PD-1 plus stEiNS. A, the orthotopic Hepa1-6 mouse model. B, Hepa1-6 postoperative recurrence model. h IVIS images of Luci+ Hepa1-6 tumor-bearing mice treated with diverse formulations. i B-ultrasound of mice livers in different groups. Created in BioRender. Y.Q. (2025) https://BioRender.com/951b31b. j H&E staining of mice livers in different groups. Scale bar, 1 mm. k Tumor growth curves (n = 5 mice per group). l Relative tumor weight with photographs of the excised tumors (n = 5 mice per group). m IHC staining of Ki67 in HCC tumor tissues after PD-1 with or without stEiNS treatment. Scale bar, 50 µm. Data are expressed as mean ± SD. Statistical significance was determined using one-way ANOVA with Tukey’s post hoc test (c, d, e), two-way ANOVA (b, k), or two-tailed Student’s t test for pairwise comparisons (l). ns P ≥ 0.05, *P < 0.05, **P < 0.01, ****P < 0.0001.
Fig. 8
Fig. 8. Molecular mechanism underlying sEiNS-mediated YTHDF1 knockdown in CD8+ T cell activation.
a KEGG analysis of the differential expression genes under TYHDF1 deletion in HCC cells. b GSEA showing the association between YTHDF1 expression and NF-κB pathway activity in HCC. c Effects of YTHDF1 on the NF-κB/caspase 3 signaling pathway (n = 3 independent experiments). d, e Immunofluorescence showing YTHDF1 (pink) and p-p65 (green) localization in PDOs (n = 3 independent experiments). Nuclei were stained with DAPI (blue). Scale bar, 50 µm. f The sequence logo plot showed the sequence conservation of NF-κB, as well as predicted score and binding sequences of five chemokines with NF-κB. Quantitative analysis of the CCL2, CCL5, CCL20, CXCL2, and CXCL12 secreted by (g) Huh7 and (h) Hepa1-6 cells in the medium after treatment with different formulations for 24 h (n = 4 independent experiments). i CUT&RUN-qPCR analysis confirmed that NF-κB could bind to CCL2 promoter region in Huh7 and Hepa1-6 cells (n = 3 independent experiments). Data are expressed as mean ± SD and were determined using two-tailed Student’s t test. ns P ≥ 0.05, *P < 0.05, **P < 0.01.
Fig. 9
Fig. 9. tEiNS-mediated RAW264.7 transcription.
a M2-polarized RAW264.7 cells were treated with tEiNS for 24 h and histone H3 and acetyl-histone H3 levels were evaluated in the extracted proteins via western blotting with corresponding antibodies (n = 3 independent experiments). b Heatmap depicting the results of RNA-seq analysis in the control and TMP195-treatment groups. c Volcano plot displaying the distributions of upregulated and downregulated genes (≥ 2-fold difference, P value < 0.05) in the TMP195 and control groups. DEGs, differentially expressed genes; non-DEGs, non-differentially expressed genes. d KEGG analysis of biological process annotations of DEGs in TMP195-treated group, showing enrichment in immune-related pathways. e Effects of TMP195 on the IFNγ/STAT1 signaling pathway (n = 3 independent experiments). f TNF-α expression profiles in RAW264.7 cells after various treatment (n = 3 independent experiments). g GSEA showing pathways associated with YTHDF1 expression in HCC. h, i GSEA showing the association between YTHDF1 expression and IFNγ pathway in HCC. Data are expressed as mean ± SD and were determined using one-way ANOVA followed by Tukey’s multiple comparisons test. ns P ≥ 0.05, **P < 0.01, ****P < 0.0001.

References

    1. Llovet, J. M. et al. Hepatocellular carcinoma. Nat. Rev. Dis. Prim.7, 6 (2021). - PubMed
    1. Li, Z. et al. Neoadjuvant tislelizumab plus stereotactic body radiotherapy and adjuvant tislelizumab in early-stage resectable hepatocellular carcinoma: the Notable-HCC phase 1b trial. Nat. Commun.15, 3260 (2024). - PMC - PubMed
    1. Ducreux, M. et al. The management of hepatocellular carcinoma. Current expert opinion and recommendations derived from the 24th ESMO/World Congress on Gastrointestinal Cancer, Barcelona, 2022. ESMO Open8, 101567 (2023). - PMC - PubMed
    1. Xu, Y. et al. Epi-immunotherapy for cancers: rationales of epi-drugs in combination with immunotherapy and advances in clinical trials. Cancer Commun.42, 493–516 (2022). - PMC - PubMed
    1. Liu, X. et al. YTHDF1 facilitates the progression of hepatocellular carcinoma by promoting FZD5 mRNA translation in an m6A-dependent manner. Mol. Ther. Nucleic Acids22, 750–765 (2020). - PMC - PubMed

MeSH terms

Substances