. 2025 Aug 8;16(1):7338.
doi: 10.1038/s41467-025-62500-8.

Early Locus Coeruleus noradrenergic axon loss drives olfactory dysfunction in Alzheimer's disease

Affiliations

Early Locus Coeruleus noradrenergic axon loss drives olfactory dysfunction in Alzheimer's disease

Carolin Meyer et al. Nat Commun. .

Abstract

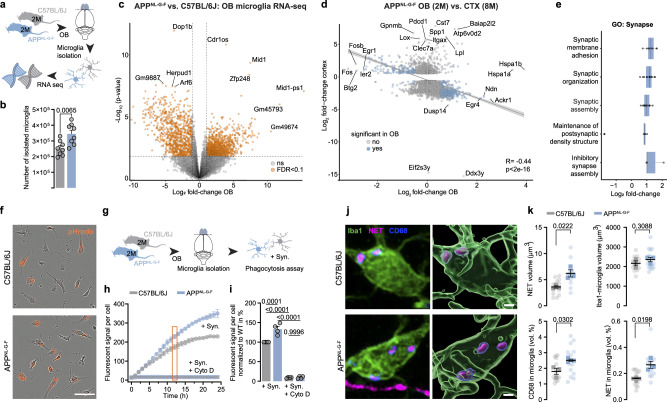
Alzheimer's disease (AD) often begins with non-cognitive symptoms such as olfactory deficits, which can predict later cognitive decline, though the mechanisms remain unclear. Pathologically, the brainstem locus coeruleus (LC), the main source of the neurotransmitter noradrenalin (NA) modulating olfactory information processing is affected early. Here we show early and distinct loss of noradrenergic input to the olfactory bulb (OB) coinciding with impaired olfaction in an AD mouse model, before appearance of amyloid plaques. Mechanistically, OB microglia recognize and phagocytose LC axons. Reducing phagocytosis genetically preserves LC axons and olfaction. Prodromal AD patients display elevated TSPO-PET signals in the OB, similarly to AppNL-G-F mice. We further confirm early LC axon degeneration in post-mortem OBs in patients with early AD. Our findings reveal a mechanism linking early LC damage to hyposmia in AD, suggesting olfactory testing and neurocircuit imaging for early diagnosis and enable timely therapeutic intervention for Alzheimer's disease.


Conflict of interest statement

Competing interests: M.B. received consulting/speaker honoraria from Life Molecular Imaging, GE Healthcare, and Roche, and reader honoraria from Life Molecular Imaging. All other authors declare no competing interests.

Figures

Fig. 1
Fig. 1. Early LC axon degeneration in the OB coincides with olfactory deficits.
a LC-NA neurons project to the olfactory bulb (OB). The OB is composed of five different layers. The dashed box highlights the analysed region in the OB. Graphic modified from Claudi, F. (2020). Mouse Top Detailed. Zenodo. 10.5281/zenodo.3925997. b Immunostaining of LC axons (NET, magenta) in the OB of C57BL/6 J and AppNL-G-F mice at 1, 2, 3 and 6 months of age. Scale bar: 50 µm. c Relative NET fibre density. (C57BL/6 J at 1,2,3,6 months: n = 4,5,6,7 and AppNL-G-F at 1,2,3,6 months: n = 5,4,6,8). d Absolute NET fibre density in different OB layers at 3 months of age. (Per layer: n = 5 C57BL/6 J vs. n = 6 AppNL-G-F). e Immunostaining of microglia (Iba1, green) and Aβ-plaques (Aβ, red). Scale bar: 50 µm. f Quantification of relative microglia density and (C57BL/6 J at 1,2,3,6 months: n = 5,5,6,7 and AppNL-G-F at 1,2,3,6 months: n = 5,4,6,8) (g) total Aβ-plaque load in AppNL-G-F mice. (1 vs. 2 months n = 4 vs. 4; 2 vs. 3 months n = 4 vs. 6; 3 vs .6 months n = 6 vs. 8). h Representative confocal images of TH-positive LC neurons (magenta) and Aβ-plaques (red). Scale bar: 50 µm. i Relative LC neuron number in 12-month-old C57BL/6 J and AppNL-G-F mice. (n = 3 vs. 3). j Olfactory tests used in study. k Time to find food in the buried food task at 1,3, and 6 months of age. (C57BL/6 J at 1,3,6 months: n = 9,14,14 and AppNL-G-F at 1,3,6 months: n = 10,18,24). l Exemplary traces of distance versus time animals spend interacting with a low (1:1000) and a high (1:1) vanilla odour concentration at 3 months of age. m Time mice spend in the investigation zone (<2 cm to cotton tip). (low/high vanilla for C57BL/6 J: n = 10/9 and low/high vanilla for AppNL-G-F: n = 11/10. n Number of entries in investigation zone (C57BL/6 J vs. AppNL-G-F: n = 9 vs. 9); Data expressed as mean ± s.e.m.; ns, not significant; *p < 0.05, **p < 0.01, ****p < 0.0001; unpaired, two-tailed t-test; 4 slices per animal in (c, d, f, i (8 slices) and k); One-way ANOVA with Sidak’s post-hoc test, 4 slices per animal in (g), Two-way ANOVA with Tukey’s post-hoc test in (m); Two-way ANOVA with Sidak’s post-hoc test in (n); Statistics shown in Supplementary Data 1. Source data are provided as a Source Data file.
Fig. 2
Fig. 2. Decreased odour-stimulated noradrenaline release in the OB of AppNL-G-F mice in vivo.
a Experimental setup of noradrenaline (NA) level measurements in vivo. Graphic modified from Carpaneto, A. (2020). Microscope Objective. Zenodo. 10.5281/zenodo.3926119, Petrucco, L. (2020). Mouse head schema. Zenodo. 10.5281/zenodo.3925903. b NA response of a C57BL/6 J mouse to three consecutive vanilla air puffs. Graphic modified from Claudi, F. (2020). Mouse Top Detailed. Zenodo. 10.5281/zenodo.3925997. c Exemplary images and heat map of baseline and odour-induced NA release in the OB, taken from a C57BL/6 J and AppNL-G-F animal. d NA release measured in the OB and cortex (CTX) of a C57BL/6 J mouse following three consecutive vanilla air puffs in comparison to the same stimuli in the OB. Graphic modified from Petrucco, L. (2020). Mouse head schema. Zenodo. 10.5281/zenodo.3925903. e Illustration of the analysis of 2 P in vivo imaging data. Graphic modified from Claudi, F. (2020). Mouse Top Detailed. Zenodo. 10.5281/zenodo.3925997. f Heat maps of NA response to one vanilla air puff comparing C57BL/6 J mice vs. AppNL-G-F mice and C57BL/6 J expressing the mutant NA sensor control. g Grand average per animal from all 324 ROIs depicted in f. Graphic modified from Claudi, F. (2020). Mouse Top Detailed. Zenodo. 10.5281/zenodo.3925997. h Distribution of all rel. changes in fluorescence for the three groups (n = 3 per group). i Fraction of ROIs responding with an increase or decrease in fluorescence (n = 3 C57BL/6 J vs. n = 3 AppNL-G-F). j NA release during stimulation with further odours. (Lemon: n = 3 vs. 3, Banana: n = 4 vs. 5, Caraway: n = 4 vs. 5). k NA imaging with blank (mineral oil) stimulation. (n = 4 vs. 5). l Overall decrease of NA release upon odour-stimulation across all tested odours. m Representative confocal images of virus expression (GPF, green) and LC axon density (NET, magenta) in the OB. Scale bar: 50 µm. n Relative NET fibre density at 3 months of age (n = 3 vs. 3); Data expressed as mean ± s.e.m.; *p < 0.05, **p < 0.01; Kruskal-Wallis test with Dunn’s multiple comparison test in (h); two-tailed Mann-Whitney test in (i); Unpaired, two-tailed t-test in (j, k, n). Mixed effects analysis in (l), genotype (F(1,22) = 27,12), Box plots show: 50th percentile (median value, line; mean value, +), 25th to 75th percentiles of dataset (box), 5th and 95th percentile (Whiskers)). Statistics shown in Supplementary Data 1. Source data are provided as a Source Data file.
Fig. 3
Fig. 3. Increased AppNL-G-F microglia phagocytosis of LC axons in the OB.
a Experimental setup of RNA sequencing from OB microglia of 2-month-old animals. Graphic modified from Claudi, F. (2020). Mouse Top Detailed. Zenodo. 10.5281/zenodo.3925997, Thompson, E. (2020). Mouse Brain Above. Zenodo. 10.5281/zenodo.3925971 and Chilton, J. (2020). Microglia resting. Zenodo. 10.5281/zenodo.3926033. b Number of isolated microglia. (n = 8 C57BL/6 J vs. n = 8 AppNL-G-F). c Volcano plot visualising differentially expressed microglia genes (orange). d Volcano plot comparing microglia genes from the OB of 2-months-old AppNL-G-F mice to the cortex of 8-months-old AppNL-G-F mice (Sobue et al., 2021). e Gene ontology (GO) enrichment analysis of genes involved in synapses. f Microglia cell pictures taken with the Incucyte live-cell analysis system after 12 h incubation with synaptosomes (pHrodo, orange). Scale bar: 50 µm. g Experimental design for phagocytosis assay. Graphic modified from Claudi, F. (2020). Mouse Top Detailed. Zenodo. 10.5281/zenodo.3925997, Thompson, E. (2020). Mouse Brain Above. Zenodo. 10.5281/zenodo.3925971 and Chilton, J. (2020). Microglia resting. Zenodo. 10.5281/zenodo.3926033. h pHrodo fluorescent signal per cell over 24 h comparing phagocytotic activity of C57BL/6 J and AppNL-G-F microglia. i Fluorescent signal per cell normalised to C57BL/6 J at the time point 12 h. (n = 4 C57BL/6 J vs. n = 4 AppNL-G-F, each 3 technical replicates). j Immunostaining and 3D reconstruction of microglia (Iba1, green), lysosomes (CD68, blue) and LC axons (NET, magenta). Scale bar: 2 µm. k Analysis of NET volume, Iba1 volume and CD68 volume. AppNL-G-F microglia contain more NET+ signal than C57BL/6 J microglia (n = 3 C57BL/6 J vs. n = 3 AppNL-G-F, each 5 technical replicates); Data expressed as mean ± s.e.m.; ns, not significant; *p < 0.05, **p < 0.01, ***p < 0.001, ****p < 0.0001; Unpaired, two-tailed t-test in (b, k); One-way ANOVA with Tukey’s post-hoc test in (k); Fig. 3d and e do not contain probability tests. Figure 3c depicts the results of a differential gene expression analysis from a quasi-likelihood negative binomial generalised log-linear model fitted to count data, and was corrected for multiple comparisons using the Benjamini-Hochberg FDR. Statistics shown in Supplementary Data 1. Source data are provided as a Source Data file.
Fig. 4
Fig. 4. Reduced phagocytosis rescues axons and hyposmia, caused by PS-MFG-E8 axon decoration.
a Immunostaining of LC axons (NET, magenta) in the OB of AppNL-G-F mice and AppNL-G-F x TSPO-KO mice at 2, 3 and 6 months of age. Scale bar: 50 µm. b Relative NET fibre density. (C57BL/6 J at 2,3,6 months: n = 4,6,8 and AppNL-G-F at 2,3,6 months: n = 4,5,5). c Buried food test comparing the time to find a food pellet is rescued in AppNL-G-F x TSPO-KO mice at 3 months of age. (C57BL/6 J: n = 14, AppNL-G-F: n = 18, AppNL-G-F x TSPO-KO: n = 10). d Immunostaining and 3D reconstruction of microglia (Iba1, green), lysosomes (CD68, blue) and LC axons (NET, magenta). Scale bar: 2 µm. e Analysis of NET volume, Iba1 volume and CD68 volume. AppNL-G-F x TSPO-KO microglia contain less NET+ signal than AppNL-G-F microglia. (n = 3 C57BL/6 J vs. n = 3 AppNL-G-F, each 5 pictures). f Immunostaining visualising LC axons (NET, magenta) tagged with phosphatidylserine (PS, yellow). Scale bar: 2 µm. g Percental volume of PS colocalised with NET fibres. (n = 3 C57BL/6 J vs. n = 3 AppNL-G-F, each 6 pictures). h Contact points (blue) between microglia (Iba1, green) and LC axons (NET, magenta). Scale bar: 20 µm, zoom in: 2 µm. i Quantification of Iba1-LC axon contact points. (C57BL/6 J: n = 3, AppNL-G-F: n = 3, AppNL-G-F x TSPO-KO: n = 3, each 6 pictures). j 3D reconstruction of MFG-E8 adaptor protein (MFG-E8, cyan) colocalised to LC axons (NET, magenta). Scale bar: 2 µm. k Analysis of MFG-E8 volume colocalised to LC axons. (C57BL/6 J: n = 4, AppNL-G-F: n = 4, AppNL-G-F x TSPO-KO: n = 4, each 6 pictures). l Confocal image showing two biocytin-filled neurons (green) of the LC (TH, magenta). Scale bar: 20 µm. m Representative traces of spontaneous action potential firing. n Quantification of action potential frequency. (C57BL/6 J: n = 8 (12 cells), AppNL-G-F: n = 10 (13 cells)). o Input resistance. (C57BL/6 J: n = 8 (10 cells), AppNL-G-F: n = 9 (9 cells)). p Representative traces of evoked action potentials (at 50 pA current injections). q Current-frequency curve showing LC neurons from AppNL-G-F mice to be less excitable (C57BL/6 J: n = 8 (12 cells), AppNL-G-F: n = 9 (11 cells)); Data expressed as mean ± s.e.m.; ns, not significant; *p < 0.05, **p < 0.01, ***p < 0.001, ****p < 0.0001; Unpaired, two-tailed t-test in (b, e, g, n, o); One-way ANOVA with Tukey’s host-hoc test in (c, i, k); Two-way ANOVA with Sidak’s post hoc test in (q); Statistics shown in Supplementary Data 1. Source data are provided as a Source Data file.
Fig. 5
Fig. 5. LC specific AppNL-G-F expression causes OB LC axon degeneration and hyposmia.
a Experimental setup of AppNL-G-F virus injection into the LC of Dbh-Cre mice at 2 months of age. Graphic modified from Claudi, F. (2020). Mouse Top Detailed. Zenodo. 10.5281/zenodo.3925997. b Immunostaining of LC axons (NET, magenta) in the OB, 3 months post-injection. Scale bar: 50 µm. c Relative NET fibre density is reduced in Dbh-hAppNL-G-F injected mice. (Dbh-EYFP: n = 5 vs. Dbh-hAppNL-G-F: n = 5, each 3 slices). d Buried food test shows that Dbh-hAppNL-G-F mice need more time to find the food pellet than Dbh-EYFP control injected mice. (Dbh-EYFP: n = 5 vs. Dbh-hAppNL-G-F: n = 5). e Correlation between NET fibre density and time to find the buried food pellet. f Immunostaining and 3D reconstruction of microglia (Iba1, green), lysosomes (CD68, blue) and LC axon debris (NET, magenta). Scale bar: 2 µm. g Analysis of NET volume inside microglia. Dbh-hAppNL-G-F microglia contain more NET+ signal than Dbh-EYFP microglia (Dbh-EYFP: n = 5 vs. Dbh-hAppNL-G-F: n = 5, each 5 pictures); Data expressed as mean ± s.e.m.; **p < 0.01, ****p < 0.0001; Unpaired, two-tailed t-test in (c, d, g). Statistics shown in Supplementary Data 1. Source data are provided as a Source Data file.
Fig. 6
Fig. 6. TSPO-PET signals in mice and humans and LC axon loss in the OB of humans indicate hyposmia.
a Immunohistochemical staining of human OB brain sections stained for LC axons (NET, brown). Scale bar: 20 µm. b Quantification of percental NET fibre area per image and (HC: n = 36 vs. pAD: n = 32 vs. AD: n = 24) (c) per patient. (HC: n = 9 vs. pAD: n = 8 vs. AD: n = 6, each 4 pictures). d Schematic of OB in the human brain and a horizontal plane through the human brain, imaged with TSPO-PET. e Quantification of TSPO signal, comparing TSPO levels in unaffected brain donors, prodromal AD and AD patients (SUV: standardised uptake value). (HC: n = 14 vs. pAD: n = 17 vs. AD: n = 16). f Odour identification test in human participants shows the percental correct identification of odours, comparing unaffected patients with prodromal AD and AD patients. (HC: n = 14 vs. pAD: n = 12 vs. AD: n = 16). g Small-animal TSPO-PET in C57BL/6 J and AppNL-G-F mice, horizontal plane through the brain at 3 months of age. h TSPO-PET signal in the OB, longitudinally measured from 2 to 12 months of age. i At 2-3 months of age, AppNL-G-F mice have a higher TSPO signal in the OB than C57BL/6 J mice, while (n = 16 C57BL/6 J vs. n = 11 AppNL-G-F) (j) in the cortex no difference in TSPO signal was observed (n = 16 C57BL/6 J vs. n = 11 AppNL-G-F); Data expressed as mean ± s.e.m.; ns, not significant; *p < 0.05, **p < 0.01, ****p < 0.0001; One-way ANOVA with Tukey’s host-hoc test in (b, c, e, f); Unpaired, two-tailed t-test in (i, j); Statistics shown in Supplementary Data 1. Illustrations in 6 d and 6 f created in BioRender. Meyer, C. (2025) https://BioRender.com/ismo1ns, https://BioRender.com/1hib26h. Source data are provided as a Source Data file.

References

    1. Report, A. A. 2023 Alzheimer’s disease facts and figures. Alzheimer’s Dement.19, 1598–1695 (2023). - PubMed
    1. Busche, M. A. & Hyman, B. T. Synergy between amyloid-β and tau in Alzheimer’s disease. Nat. Neurosci.23, 1183–1193 (2020). - PMC - PubMed
    1. Reardon, S. Alzheimer’s drug donanemab: what promising trial means for treatments. Nature617, 232–233 (2023). - PubMed
    1. Sims, J. R. et al. Donanemab in early symptomatic Alzheimer disease. JAMA330, 512–527 (2023). - PMC - PubMed
    1. Braak, H., Thal, D. R., Ghebremedhin, E. & Tredici, K. D. Stages of the pathologic process in Alzheimer disease: Age categories from 1 to 100 years. J. Neuropathol. Exp. Neurol.70, 960–969 (2011). - PubMed

MeSH terms

Substances