. 2025 Aug 8;16(1):7325.
doi: 10.1038/s41467-025-61319-7.

Glial reactivity and cognitive decline follow chronic heterochromatin loss in neurons

Affiliations

Glial reactivity and cognitive decline follow chronic heterochromatin loss in neurons

A G Newman et al. Nat Commun. .

Abstract

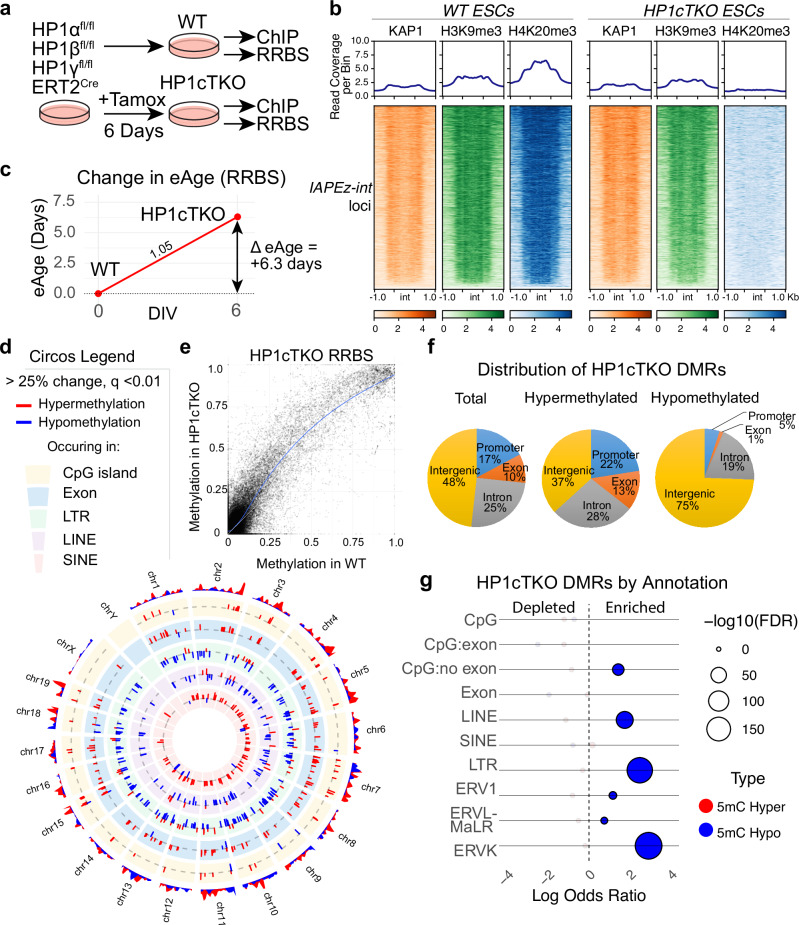
In aging cells and animal models of premature aging, heterochromatin loss coincides with transcriptional disruption including the activation of normally silenced endogenous retroviruses (ERVs). Here we show that loss of heterochromatin maintenance and de-repression of ERVs result in a chronic inflammatory environment characterized by neurodegeneration and cognitive decline in mice. We identify distinct roles for HP1 proteins to ERV silencing where HP1γ is necessary and sufficient for H4K20me3 deposition and HP1β deficiency causes aberrant DNA methylation. Combined loss of HP1β and HP1γ results in loss of DNA methylation at ERVK elements. Progressive ERV de-repression in HP1β/γ DKO mice is followed by stimulation of the integrated stress response, an increase of Complement 3+ reactive astrocytes and phagocytic microglia. This chronic inflammatory state coincides with age-dependent reductions in dendrite complexity and cognition. Our results demonstrate the importance of preventing loss of epigenetic maintenance that is necessary for protection of postmitotic neuronal genomes.


Conflict of interest statement

Competing interests: The authors declare no competing interests.

Figures

Fig. 1
Fig. 1. Loss of both HP1β and HP1γ results in activation of noncoding elements and induction of the integrated stress response.
a Genes (inc. aggregate counts of repetitive elements measured using TETranscripts) significantly changed in young and aged HP1β/γDKO hippocampi (689 genes, edgeR quasi-likelihood F-test, corrected p < 0.05). b Manhattan plot of loci specific significant changes (SalmonTE*,) to repetitive element transcription in HP1 mutants. Significantly changed repeats (DESeq2 negative binomial generalized linear model, Wald test, negative binomial generalized linear model, adj p < 0.05 & log2FC > 1) are colored by repeat class. c Kimura Distance distribution of Repeats significantly changed in HP1 mutants. Repeats from the ERVK subfamily, which contains the evolutionarily recent IAPs, is most strongly affected in HP1β/γDKO hippocampi, which is reflected in a very small Kimura distance. Here the background distribution is a 1/1000th downsampling of all repeats in the dataset. d In situ hybridization using a consensus probe for IAP in P0 brains (representative image shown for 3 attempted assays) and RNAseq read coverage over the IAPEz internal fragment in young and aged adults (read coverage is RPKM normalized reads per 50 bp bin). Scale bar = 500μm. e Enrichment map of significant reactome pathways observed from Gene Set Enrichment Analysis (GSEA) in aged HP1β/γDKO transcriptomes. Reactome pathways were filtered to FDR < 0.25 (Figure S2f, Supplementary Data 3).
Fig. 2
Fig. 2. HP1γ is necessary and sufficient for deposition of H4K20me3.
a H3K9me3 levels are unchanged in HP1β and HP1γ deficient neurons. H4K20me3, is unaffected in wild-type interneurons but lost completely in HP1γ-deficient pyramidal neurons. Representative images are shown from 3 attempted assays. b Re-addition of HP1γ into developing mutant brains by in utero electroporation can restore H4K20me3 (magnification, nuclei outlined by dashed circles). (CP = cortical plate IZ = intermediate zone, SVZ = subventricular zone, VZ = ventricular zone). Representative images are shown from 3 attempted assays. c Schematic of HP1γ protein product with domains and point mutations tested. d Co-immunoprecipitation of Suv420h2 with HP1 proteins and point mutants confirms residues in the chromoshadow domain (CSD) of HP1γ are essential for its binding with Suv420h2. Representative blots are shown from 2 attempted assays, reverse immunoprecipitation can be found in Supplemental information. e Co-localization of C terminal GFP-tagged HP1α, HP1β, HP1γ and HP1γ mutants with C terminal myc-tagged SUV420H2. Representative images are shown from 2 attempted assays.
Fig. 3
Fig. 3. DNA methylation is further perturbed in HP1cTKO ES cells.
a Schematic of the HP1cTKO RRBS experiment where HP1αfl/flHP1βfl/flHP1γfl/flERT2Cre ES cells are left untreated (WT) or treated with tamoxifen (HP1cTKO) for 6 days in vitro before profiling DNA methylation status by Reduced Representation Bisulphite Sequencing (RRBS) and H3K9me3, H4K20me3 and KAP1 by ChIPseq. b Coverage of KAP1, H3K9me3 and H4K20me3 over IAPEz internal segments (int) and adjacent LTRs is reduced in HP1cTKO ES cells. Given the deletion of HP1γ in HP1cTKO, H4K20me3 is lost entirely. c Profiling of ~18,000 CpG sites in WT and HP1cTKO ES cells reveals that deletion of HP1 proteins initiates a positive change in eAge. d Circos plot of methylation changes that are greater than 25% (q < 0.01) plotted by chromosome by annotation. The magnitude of change is represented on the radial y axis. The outermost ring represents methylation change density. Inner rings annotate methylation changes occurring to CpG islands, exons, LTRs, LINEs and SINEs respectively. e Scatterplot of cytosine methylation observed in both HP1cTKO and WT Reduced Representation Bisulfite Sequencing. f Distribution of HP1cTKO Differentially Methylated Regions (DMRs) by genic feature. g Odds ratios of HP1cTKO DMRs significantly changed (q < 0.05, > 25% change) plotted against the adjusted P value (FDR) of the respective hypergeometric test of DMRs overlapping with the annotation. CpG = CpG island, CpG:exon is the subset of CpG islands overlapping with exons, whereas CpG:no exon are CpG islands that do not overlap. ERV1, ERVL-MaLR and ERVK are subsets of LTR.
Fig. 4
Fig. 4. DNA methylation fidelity is progressively compromised in HP1 deficient hippocampi.
a Schematic of experimental design showing determination of paired 5-methyl Cytosine (5mC) and 5-hydroxy-methyl Cytosine (5hmC) measurements from young and aged HP1βKO, HP1γKO and HP1β/γDKO mutant hippocampal lysates by Reduced Representation Bisulfite Sequencing (RRBS). Genotypes that follow are abbreviated to HP1βKO, HP1γKO, and HP1β/γDKO respectively for clarity. b Global 5mC and 5hmC methylation across biological replicates sampled. c Heatmap of all observed Differentially Methylated Regions (5mC or 5hmC) that change 25% or more and are statistically significant below q = 0.05. DMRs (cytosine positions, rows) observed across genotypes are accompanied by row annotations corresponding to genomic context denoted by being a CpG island, in a gene (intron/exon), repetitive element (LINE, SINE, ERV1, ERVL_MaLR, ERVK or other nonredundant LTRs), overlap with the protocadherin cluster (denoted cPcdh), its chromatin state defined by the 18 state ChromHMM model from P0 mouse cortex (ChromHMM), its overlap with promoters or enhancers defined by the Enhancer-gene map from ENCODE 3, and chromosome (Chr). d Total distribution of DMRs by genotype and direction of change (hypomethylation ‘hypo’ or hypermethylation ‘hyper’). e Odds Ratios of DMRs significantly changed due to genotype or age are plotted against the Q value (FDR) resulting from the hypergeometric test of DMRs overlapping with the annotation. CpG um = Unmasked CpGs, CpG exon = CpG islands overlapping with exons, CpG noexon = CpG islands not overlapping with exons, LTR annotation here refers to all LTRs including ERV1, ERVL MaLR, ERVK etc.
Fig. 5
Fig. 5. Chronic de-repression of ERVs coincides with the appearance of C3+ reactive Astrocytes and increased CD68+ Microglia.
Moderate Complement 3 (C3) RNA can be detected by RNAscope in aged WT (a–c), where it can be detected in most cells of the hippocampus including CA1 and CA3 pyramids. (Representative images are displayed here after testing across 3 brains per condition). De-repression of IAP transcripts in aged HP1βfl/flHP1γfl/flEmx1Cre (white, d) corresponds with large C3+ islands (arrows in d) that can be found in the Stratum Radiatum (magnified in e) and emanating from the Stratum Pyramidale (magnified in F). Such C3 foci are surrounded by microglia with distinct morphology (compare b, ce, f). C3+ foci found in the Stratum Radiatum of HP1βfl/flHP1γfl/flEmx1Cre hippocampi are Slc1a3+ astrocytes (g, magnified in h, i). Representative RNAscope images (a-i) are from two attempted assays with a third shown in Figure S7. Scalebars (a–i) are all 50μm. j Representative images of CA3 pyramidal layers stained for GFAP, Iba1 and Dapi. Iba1+ cells entering the stratum pyramidale are indicated with solid arrows. k Quantification of GFAP+ and Iba1+ cells (mean count ± SEM & raw data points) quantified across apical, somal, and basal regions in CA1 and CA3 fields (see also Figure S6). Statistics two-way ANOVA with estimated marginal means post-hoc test with Tukey’s familywise correction. nWT(young) = 8, nWT(aged) = 8, nHP1βKO(young) = 10, nHP1βKO(aged) = 14, nHP1γKO(young) = 8, nHP1γKO (aged) = 8, nHP1β/γ DKO (young) = 10, nHP1β/γ DKO (young) = 14, where n is a single image taken from one of three biological replicates. Adjusted P values for genotype test within age (Iba1): aged HP1β/γDKO vs WT p = 0.003, aged HP1β/γDKO vs aged HP1γKO p = 0.0152, aged HP1β/γDKO vs aged HP1βKO p = 0.0152. Adjusted P values for age test within genotype: Iba1 HP1β/γDKO age p < 0.0001, GFAP HP1β/γDKO age p = 0.0087. l Iba1+ microglia that can be found in the stratum radiatum surrounding GFAP+ astrocytes contain large CD68+ compartments suggesting endosomal activity. m Quantification of Microglial activation (from l) measured by the proportion of CD68+ area within Iba1+ microglia. Statistics two-way ANOVA with estimated marginal means post-hoc test with Tukey’s familywise correction. nWT(young) = 3, nWT(aged) = 6, nHP1βKO(young) = 3, nHP1βKO(aged) = 7, nHP1γKO(young) = 3, nHP1γKO (aged) = 6, nHP1β/γ DKO (young) = 4, nHP1β/γ DKO (young) = 6, where n is a single image taken from one of three biological replicates. Adjusted P values for genotype test within age: aged HP1β/γDKO vs WT p = 0.008, aged HP1β/γDKO vs aged HP1γKO p = 0.0444, aged HP1β/γDKO vs aged HP1βKO p = 0.0064. Box and whisker plots display median, bounds of box at 25th and 75th percentiles, and whiskers to farthest datapoint within 1.5 * the interquartile range. Immunohistochemistry of Complement C3 in aged hippocampi in WT (n), HP1βKO (p), HP1γKO (r), HP1β/γDKO (t), with magnifications (o, q, s, u, respectively). HP1β/γDKO hippocampi show C3 protein accumulation in the end feet of astrocytic processes (u, white arrows). C3 protein accumulation in end feet was observed twice in two separate assays. All raw data and exact P values can be seen in the Source Data file.
Fig. 6
Fig. 6. Acute introduction of IAP ssRNA induces an inflammatory response in astrocytes.
a Domain map of full length IAP sequence used for generation of ssRNA. b Schematic showing experimental design where primary astrocytes and microglia mixed cultures are exposed to a pulse of transfection reagent (untreated, UN), a 1 kb random scrambled ssRNA (scr), IAP-ssRNA, or pseudo (ψ)- IAP ssRNA, where ψ-IAP is generated from the same template but with ψ-uracil. Media and cytosolic lysates were then incubated with Proteome Cytokine Array Panel A. c Summary quantification of significant changes to cytokine expression following acute ssRNA incubation. Cytokine changes are plotted as dots proportional to their normalized expression. Statistically significant changes (one-way ANOVA for condition by gene followed by Dunnett’s, adjusted P value < 0.05) are colored according to their log2Fold change over untreated. UNMedia n = 4, UNCytosol n = 3, scrMedia n = 3, scrCytosol n = 3, ψ-IAPMedia n = 3, ψ-IAPCytosol n = 3, IAPMedia n = 3, IAPCytosol n = 3, where n is a biological replicate. d Immunofluorescence stain of mixed glial cultures comprised of Iba1+ microglia and GFAP+ astrocytes stained for CCL5 (RANTES), repeated once for each of the corresponding 3 biological replicates in (e). e Western blot of whole cell lysates from mixed cultures measured 48 hrs after being treated with transfection reagent only (untreated, UN), random scramble ssRNA (scr), ψ-IAP ssRNA (ψ), IAP-ssRNA or Lipopolysaccharide (LPS). f Quantification of western blots (mean ± SD) where lower molecular weight proteins (CCL5, ISG15, Iba1) were normalized to H3 and remaining higher molecular weight proteins normalized to β-actin over n = 3 biological replicates. Box and whisker plots display median, bounds of box at 25th and 75th percentiles, and whiskers to farthest datapoint within 1.5 * the interquartile range. One-way ANOVA followed by Dunnett’s test, CCL5 IAP vs UN p = 0.00441283, pIRF7/IRF7IAP vs UN p = 0.0000022503, pIRF7/IRF7 scrRNA vs UN p = 0.00078752. g Airyscan super-resolution images of mixed glial cultures following 48hr incubation with IAP and control ssRNAs. Top row with IRF7 in magenta, GFAP cyan, CCL5 in yellow and DAPI in white and single CCL5 channel images. Magnification in the bottom panel shows single channel images, with the bottom row displaying merged CMY images and CMY + DAPI images. CCL5 and IRF7 accumulation was observed consistently in two separate assays. All raw data and exact P values can be seen in the Source Data file.
Fig. 7
Fig. 7. HP1 deficiency causes age related behavioral abnormalities and CA3 dendritic tree degeneration.
a CA3 Dendritic Complexity in young and aged HP1 mutants by Golgi impregnation and Scholl analysis. Deficits in basal dendrite complexity can be observed in young HP1βKO and HP1β/γ DKO animals. While basal dendrite complexity is nearly identical in aged HP1βKO, HP1β/γ DKO basal dendrites show an age dependent degeneration, losing almost 50% of their complexity. nWT(young) = 35, nWT(aged) = 17, nHP1βKO(young) = 27, nHP1βKO(aged) = 14, nHP1γKO(young) = 35, nHP1γKO (aged) = 23, nHP1β/γ DKO (young) = 42, nHP1β/γ DKO (young) = 21, where n is # of neurons counted over 3 biological replicates. Two-way ANOVA with Bonferroni adjustment on multiple comparison (two tailed). b Histograms of performance in the circular Barnes Maze (mean count ± SEM & raw data points, green = target hole, red = opposite). Histograms plot mean headpokes ±SEM. of nWT(young) = 18, nWT(aged) = 16, nHP1βKO(young) = 11, nHP1 β KO(aged) = 7, nHP1γKO(young) = 6, nHP1γKO (aged) = 5, nHP1β/γ DKO (young) = 11, nHP1β/γ DKO (young) = 12. Two way ANOVA, Bonferroni adjustment on multiple comparison, two-tailed. HP1β/γ DKOyoung vs WTyoung 24 h test p = 0.0009. HP1β/γ DKOyoung vs WTyoung 24 h test p = 0.0081. Box and whisker plots (a, b) display median, bounds of box at 25th and 75th percentiles, and whiskers to farthest datapoint within 1.5 * the interquartile range. All raw data can be seen in the Source Data file.

References

    1. Madabhushi, R. et al. Activity-Induced DNA Breaks Govern the Expression of Neuronal Early-Response Genes. Cell161, 1592–1605 (2015). - PMC - PubMed
    1. Wu, W. et al. Neuronal enhancers are hotspots for DNA single-strand break repair. Nature593, 440–444 (2021). - PMC - PubMed
    1. Stefanatos, R. & Sanz, A. The role of mitochondrial ROS in the aging brain. FEBS Lett.592, 743–758 (2018). - PubMed
    1. Lu, T. et al. Gene regulation and DNA damage in the ageing human brain. Nature429, 883–891 (2004). - PubMed
    1. Koen, J. D. & Rugg, M. D. Neural Dedifferentiation in the Aging Brain. Trends Cogn. Sci.23, 547–559 (2019). - PMC - PubMed

MeSH terms

LinkOut - more resources