. 2025 Aug 8;16(1):7334.
doi: 10.1038/s41467-025-62736-4.

Pupil size modulation drives retinal activity in mice and shapes human perception

Affiliations

Pupil size modulation drives retinal activity in mice and shapes human perception

Tjasa Lapanja et al. Nat Commun. .

Abstract

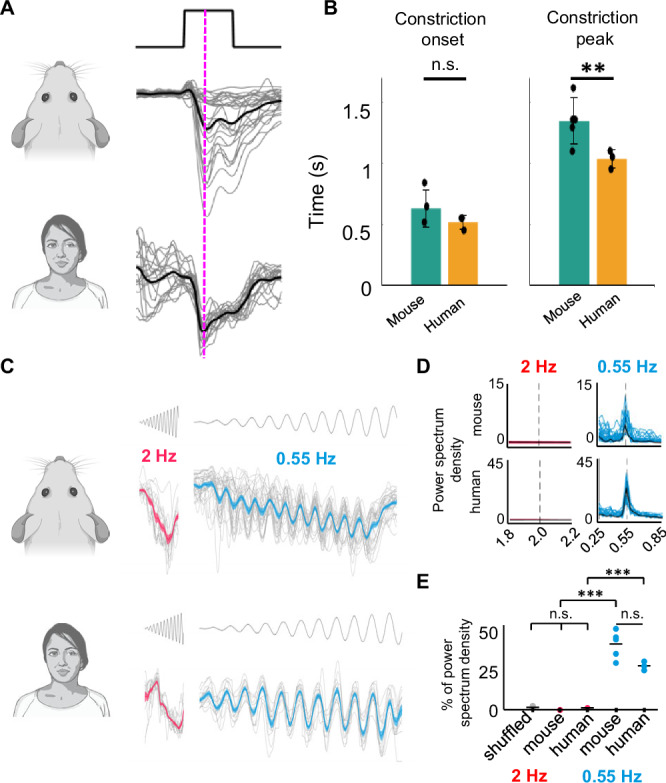
Retinal adaptation is assisted by the pupil, with pupil contraction and dilation thought to prevent global light changes from triggering neuronal activity in the retina. However, we find that pupillary constriction from increased light, the pupillary light reflex (PLR), can drive strong responses in retinal ganglion cells (RGCs) in vivo in mice. The PLR drives neural activity in all RGC types, and pupil-driven activity is relayed to the visual cortex. Furthermore, the consensual PLR allows one eye to respond to luminance changes presented to the other eye, leading to a binocular response and modulation during low-amplitude luminance changes. To test if pupil-induced activity is consciously perceived, we performed psychophysics on human volunteers, finding a perceptual dimming consistent with PLR-induced responses in mice. Our findings thus uncover that pupillary dynamics can directly induce visual activity that is consciously detectable, suggesting an active role for the pupil in encoding perceived ambient luminance.


Conflict of interest statement

Competing interests: The authors declare no competing interests.

Figures

Fig. 1
Fig. 1. Pupillary constriction’s predicted monocular and binocular responses in RGC axons in vivo, compared to canonical responses.
A Schematic of retinal AAV injection to label RGC axons in the dLGN (green) for in vivo 2-photon imaging. B RGC axons in the dLGN (C), RGC boutons during 2-photon imaging (representative of N = 12 animals). D Schematic of possible OFF cell responses: an OFF cell where pupillary constriction plays no role in the response, it only shows a canonical response at light offset to stimulus presented to the injected eye, from the screen contralateral to the recording site (left), an OFF cell exhibiting a predicted pupil-induced response from contralateral screen stimulus (middle, red arrow), an OFF cell exhibiting a predicted pupil-induced binocular response to stimulating the non-injected eye from ipsilateral screen stimulus (right, red arrowhead). E Example RGC activity showing canonical OFF response to contralateral eye stimulation (left, purple) and no binocular response to ipsilateral eye stimulation (right, green), contralateral pupil responses to each stimulus in bottom. Data are presented as mean ± SEM. F Example RGC showing a response consistent with predicted pupil-induced monocular response to contralateral eye stimulation (left, purple, red arrow), as well as a binocular response to ipsilateral eye stimulation (right, green, red arrowhead), contralateral pupil responses to each stimulus in bottom. Data are presented as mean ± SEM. All flashes are from a 9.5 Lux baseline to 31 Lux.
Fig. 2
Fig. 2. Binocular RGC activity is due to pupillary constriction.
A RGC responses to full-field flash stimulus to the contralateral (top, purple) or ipsilateral eye (bottom, green) in anesthetized animals, for example response (middle, mean ± SD) and heatmap of individual boutons (right). QI =  quality index (see “Methods”) (n = 649 boutons N = 5 animals). Throughout figure, purple indicates contralateral visual stimulation and green ipsilateral stimulation. B Population average of heatmaps in A (mean ± SEM). C Histogram of responses in (A). D Same as (A), but for awake, freely moving RGC responses (n = 709 boutons, N = 4 animals). E Population average of heatmaps in (D). F Histogram of responses in (D). G Pupillary constriction from full-field stimulus (middle) to either contralateral (left) or ipsilateral (right) stimulation (mean ± SEM), and RGC population responses in the same animals (bottom) (mean ± SEM n = 849 boutons, N = 5 animals). H Peak non-canonical OFF responses (normalized, RMI) in anesthetized and awake animals to contralateral or ipsilateral stimulation (n = 649, N = 5 and n = 709, N = 4, respectively). Two-sided two-sample t-test. Violin plot with median labeled as white point. I Spearman correlation between RGC activity and pupillary constriction due to contralateral (top) or ipsilateral (bottom) stimulation, before and after atropine. ***p < 0.001 (two-sample two-sided Kolmogorov–Smirnov test) (n = 849 boutons, N = 5 animals, n = 848 boutons, N = 4 animals, respectively). J Heatmap of RGC axons imaged in G. K RGC responses of boutons in (GI) after administration of atropine to the contralateral eye, eliminating non-canonical OFF responses due to contralateral stimulation (left) and ipsilateral responses entirely (right). L Heatmap of RGC axons after TTX injection into the ipsilateral eye, seeing no change in contralateral activity, including the non-canonical OFF response (left), but completely eliminating ipsilateral responses (right) (n = 187 boutons, N = 3 animals). (M) Peak non-canonical OFF responses for contralateral (left) or ipsilateral (right) stimulation shown in (IK). ***p < 0.001 (two-sample two-sided t-test, multiple comparisons corrected with Bonferroni correction). Violin plot with median labeled as white point.
Fig. 3
Fig. 3. Pupil-induced RGC responses are present across RCG types.
A UMAP of 5 clusters of RGC responses to contralateral full-field chirp stimulus (each with unique color). B Example field of view, color coded with cluster identity (representative of N = 3 animals). C Responses of RGC boutons to chirp presented to the contralateral eye, showing 3 OFF RGC and 2 ON RGC types (each with unique color as in (A)). Top row is example RGC, bottom is population average (n = 1492 boutons, N = 3 animals). D Responses of each RGC cluster in C to chirp presentation to the ipsilateral eye, color-coded as in (A). Arrowheads = responses consistent with pupil-induced responses. Box = lack of activity in amplitude or frequency ramps. E UMAP of 2 clusters of RGC ipsilateral responses to chirp stimulus in D (yellow and green). F Population responses of ipsilateral chirp responses: type 1 (middle, green) = a delayed ON response, type 2 (bottom, yellow) = a delayed OFF response followed by oscillating rebound. G Top: PLR phases during 3 s Full field flash (Supplemental Fig. 4). For boutons in each RGC subclass: peak response time (color) and suppressed response time (gray) to ipsilateral stimulation during the Full-Field Flash section of chirp stimulation for each bouton passing response threshold (OFF RGC types: 1: peak = 276, suppressed = 3, 2: peak = 137, suppressed = 1, 3: peak = 268, suppressed = 0. ON RGC types: 4: peak = 60, suppressed = 7, 5: peak = 61, suppressed = 61). Color-coded based on their contralateral response as in (A). H Same example field of view as 3B, with 2 ipsilateral clusters color-coded based on ipsi cluster obtained in (D, E). (representative of N = 3 animals). I Prevalence of each ipsilateral response in the 5 contralaterally-determined clusters, with type 1 (green) overwhelmingly in OFF RGCs and type 2 (yellow) in ON RGCs.
Fig. 4
Fig. 4. Pupil-induced RGC activity is relayed to the visual cortex.
A Experimental setup. 2-photon imaging of GCaMP8f expressing LGN axon terminals in V1 (green). B Example field of view (representative of N = 3 animals). C Responses of LGN axons to full field visual stimulation of contralateral (purple) or ipsilateral (green) eye (n = 82 boutons, N = 3 animals). D Response quality index of responses during stimulation. Contralateral stimulation (left, purple): mean = 0.24, above response threshold (0.3): 18.3%. Ipsilateral stimulation (right, green): mean=0.31, above response threshold (0.3): 56.1%. (n = 82 boutons, N = 3 mice). Boxplot values, from left to right: Mean (0.24, 0.31), lower box (0.19, 0.23), higher box (0.29, 0.39), lower whisker (0.12, 0.13), higher whisker (0.42, 0.57), max (0.5, 0.57), min (0.12, 0.13). E Response dynamics of LGN responses. Left: Population response of boutons to contralateral (top, purple) and ipsilateral (bottom, green) stimulation. Right: Time of peak response. Right top, Purple: the difference between stimulus offset and maximal response to contralateral stimulation. Right bottom, Green: the difference between stimulus onset and maximal response to ipsilateral stimulation. Red: time shown in histogram. F Experimental setup of layer 2/3 neurons in V1 (green). G Example field of view (representative of N = 3 animals). H K-means clustering in PCA space of the average responses of V1 cells (n = 152 cells, N = 2 animals), 2 clusters: OFF (green) and ON (yellow)-responding. I, J top: examples of one OFF (green) and one ON (yellow) cell response. Black, vertical lines = beginning ipsilaterally-presented LED flash. Bottom, gray: trial-averaged pupil area traces (z-score). Solid trace = mean, Shaded areas = SEM. K Histogram of the delay onset, for all the cells, color-coded according to the functional cluster (OFF green, ON yellow). L Average responses (n = 152 cells, N = 2 animals). Black, vertical lines = flash; the black dashed line = mean pupil response ± SEM. Blue is an activity increase, teal decrease. M Population response (OFF in green, ON in yellow), plotted against pupil response (gray, same as in (L)), all mean ± SEM. N Histogram of the percentage of the trial correlated with the pupil, calculated for all the cells recorded (n = 250 cells, N = 2 animals).
Fig. 5
Fig. 5. Pupil-induced binocular modulation facilitates low contrast responses.
A Predicted pupil-induced response in RGCs to contralateral stimulation (Left) and both screen stimulation (Right), showing increased pupil constriction (compare double red arrow in Contra to Both conditions), inducing predicted pupil-induced monocular response (Left, reaching dotted red line) and predicted binocular facilitation (Right, arrow) in OFF RGC responses. B Example RGC bouton response to low (left) or high (right) contrast stimulation from the contralateral screen (Top, purple) or both screens (Bottom, yellow). Traces are mean ± SD. Arrow = Pupil-induced binocular facilitation (as predicted in (A)), Arrowhead = Canonical OFF response. Throughout figure, purple is contralateral eye stimulation, yellow is both eye stimulation. C Heatmap (Top) of RGC difference between binocular and monocular responses (z-score), as well as population z-score average (Bottom trace) (n = 287 (low contrast, orange), 519 (high contrast, green) boutons, N = 5 animals). D Pupil response to contralateral (purple) or both eye (yellow) stimulation (top) compared to population average of RGC activity (bottom). Arrow = predicted binocular facilitation. (n = 287 (low contrast), 519 (high contrast) boutons, N = 5 animals). Traces are mean ± SEM. E Same as in (D), but after atropine administration to the contralateral eye, eliminating binocular facilitation (arrow). (n = 218 (low contrast), 776 (high contrast) boutons, N = 4 animals). Traces are mean ± SEM. F Same as in (D), but after carbachol administration, eliminating binocular facilitation (arrow). (n = 133 (low contrast), 307 (high contrast) boutons, N = 3 animals). Traces are mean ± SEM. G Spearman correlation between increased pupil contraction and binocular facilitation before (orange, green) and after (gray) atropine for low (Left, orange) and high (Right, green) contrast, with RGC activity to low contrast being substantially correlated to pupil activity. ***p < 0.001, *p = 0.0106 (two-sample two-sided k-s test). H Plot of RGC activity during stimulation onset to both eye stimulation (y-axis) against the sum of responses to the individual screens (x-axis) for low contrast (Left, orange) and high contrast (Right, green) (n = 287 (low contrast), 519 (high contrast) boutons, N = 5 animals). Low contrast = 9.5 Lux baseline to 20 Lux, high contrast = 9.5 Lux to 65 Lux.
Fig. 6
Fig. 6. The dynamics of pupillary constriction constrain PLR-driven RGC activity.
A Design of visual stimulus of increasing contrast that allows for the pupil to track each contrast change, by having the flashes presented at 0.55 Hz (left, blue), compared to stimulus of identical properties, but presented at 2 Hz (right, red). Horizontal arrows indicate flash length at each frequency. Throughout the figure, blue indicates 0.55 Hz stimulus, red 2 Hz stimulus. B Pupil size of contralateral eye due to contralateral (purple), ipsilateral (green), or both screen (yellow) stimulation at either 0.55 Hz (left) or 2 Hz (right). (N = 5 (0.55 Hz) and 3 (2 Hz) animals). Mean ± SEM. C, D Population RGC axon activity from 0.55 Hz (left) or 2 Hz (right) stimulation to either the contralateral (C, purple) or ipsilateral (D, green) eye. (n = 1381 (0.55 Hz), 648 (2 Hz) boutons, N = 9 (0.55 Hz), 5 (2 Hz) animals). E Increased pupillary constriction on both eyes compared to the contralateral eye for 0.55 or 2 Hz amplitude ramp. n.s. (two sample t test) (N = 5 (0.55 Hz) and N = 3 (2 Hz) animals, 6 repeats). White point = median. F Example RGC axon activity when presented with 0.55 Hz (left) or 2 Hz (right) amplitude ramp, with binocular facilitation (both eye responses (yellow trace) greater than contra eye responses (purple trace)) only observed at 0.55 Hz. Mean ± SD. G binocular facilitation (RMI) for top 50% OFF RGCs at each peak of the ramp at 2 Hz (top, red), 0.55 Hz (middle, blue), or 0.55 Hz after atropine administration (bottom, gray). Arrow = peak binocular facilitation. (n = 691 (0.55 Hz), 351 (0.55 Hz + atropine), n = 324 (2 Hz)). Color = peak number. Bars = Mean. H Population means for (G). bars = SEM. I, J Paired binocular facilitation in individual boutons at low contrast (peaks 2, 3, 4) or high contrast (peaks 9, 10, 11) in (I) anesthetized, top 50% boutons (n = 691 (0.55 Hz), 351 (0.55 Hz+atropine), 324 (2 Hz) boutons, N = 5 (0.55 Hz), 4(0.55 Hz+atropine), 3(2 Hz)) or (J) awake animals, all boutons. ***p < 0.001 (paired two-sided t test) (n = 213 (0.55 Hz), 312 (2 Hz) boutons, N = 4 animals). Line =  mean. K Mean RMI difference at low contrast in (J). ***p < 0.001 (two-sample two-sided t-test). White point = median.
Fig. 7
Fig. 7. Pupillary kinetics are conserved between the mouse and human.
A Average pupillary response to 3-s full-field flash stimulus in mice (top, N = 5 animals) and human (bottom, N = 3 volunteers), the dotted purple line highlighting peak pupil response coincident with mouse delayed ON RGC responses (see Figs. 1 and 2). B Pupillary constriction onset (left) and peak of constriction (right) for data in (A) (mean ± SEM) comparing mice (left, green) and human (right, orange). **p = 0.008 (two-sided t-test). C Average pupillary response to 2 Hz (left, red) or 0.55 Hz (right, blue) stimulation in mice (top, N = 5 animals) and humans (bottom, N = 3 volunteers). D Fast Fourier Transform (FFT) of pupillometry data in (C), showing no signal from the 2 Hz stimulus centered on 2 Hz (left, red), but a significant peak from the 0.55 Hz stimulus centered on 0.55 Hz (right, blue). E Percent of the entire FFT signal (above 0.25 Hz) at either 2 Hz (red) or 0.55 Hz (blue) for those respective stimuli, for mouse and human. ***p < 0.001 (one-way ANOVA) (N = 3 humans, 5 mice).
Fig. 8
Fig. 8. Humans perceive luminance transient coinciding with pupil constriction.
A Setup of human psychophysics experiment. Top: Human subjects (4 male and 4 female) were presented full-field stimulus on computer screen and asked to report perceived change in luminance during a 3-s flash. Middle: Stimulus, a full-field-flash of high contrast (corresponding to LL5 stimulus presented in mice) or low contrast (corresponding to LL1 stimulus presented in mice). Bottom: Prediction of perceptual dimming. We hypothesized that subjects would perceive dimming of the stimulus in time with PLR due to decreased luminance on the retina (red arrow). B Examples of 2 subjects reporting perceptual dimming during low-contrast (orange) and high-contrast (green) stimulus. Change in pupil size during stimulus presentation (dark gray: mean, light gray: individual trials). Dots: Time of reported dimming. X: trials with no detected dimming. Throughout figure, orange indicates low contrast stimulus, green high contrast. C Perceptual dimming in all volunteers. Top: Dimming detection during low-contrast stimulation. Time of dimming detection for each of the subjects (colored dots) and number of trials with no detection (black X). The plot is the change in pupil size (line: mean, shaded area ± SEM). Bottom; Same as top, but for high-contrast stimulation. Blue line = 1 s. D Detection times shown in C (bottom histograms) aligned to pupil response (top traces). E Percentage of trials where dimming was detected during low contrast (orange) compared to high contrast (green) stimulation, n = 8, p = 0.013 (*), paired two-sided t-test. Black dot is mean across volunteers, bars indicate ± SEM. F Difference between each dimming detection and PLR peak time during low-contrast stimulation for all the subjects. PLR start and end (dotted line) are approximated from mean PLR shown in (C). (n = 40 detection events, N = 6 humans).

Similar articles

References

    1. Erisken, S. et al. Effects of locomotion extend throughout the mouse early visual system. Curr. Biol.24, 2899–2907 (2014). - PubMed
    1. McGinley, M. J. et al. Waking state: rapid variations modulate neural and behavioral responses. Neuron87, 1143–1161 (2015). - PMC - PubMed
    1. Reimer, J. et al. Pupil fluctuations track fast switching of cortical states during quiet wakefulness. Neuron84, 355–362 (2014). - PMC - PubMed
    1. Schröder, S. et al. Arousal modulates retinal output. Neuron107, 487–495.e9 (2020). - PMC - PubMed
    1. Vinck, M., Batista-Brito, R., Knoblich, U. & Cardin, J. A. Arousal and locomotion make distinct contributions to cortical activity patterns and visual encoding. Neuron86, 740–754 (2015). - PMC - PubMed

LinkOut - more resources