. 2025 Aug 8;16(1):7317.
doi: 10.1038/s41467-025-62739-1.

Structure and function of the human apoptotic scramblase Xkr4

Affiliations

Structure and function of the human apoptotic scramblase Xkr4

Sayan Chakraborty et al. Nat Commun. .

Abstract

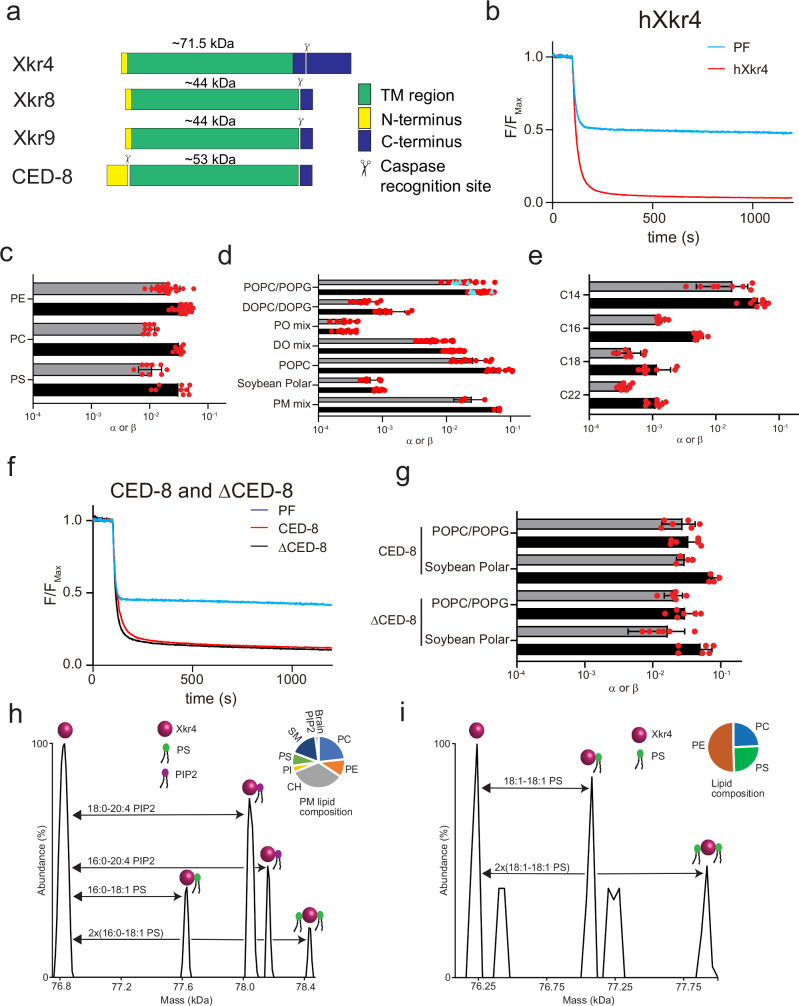
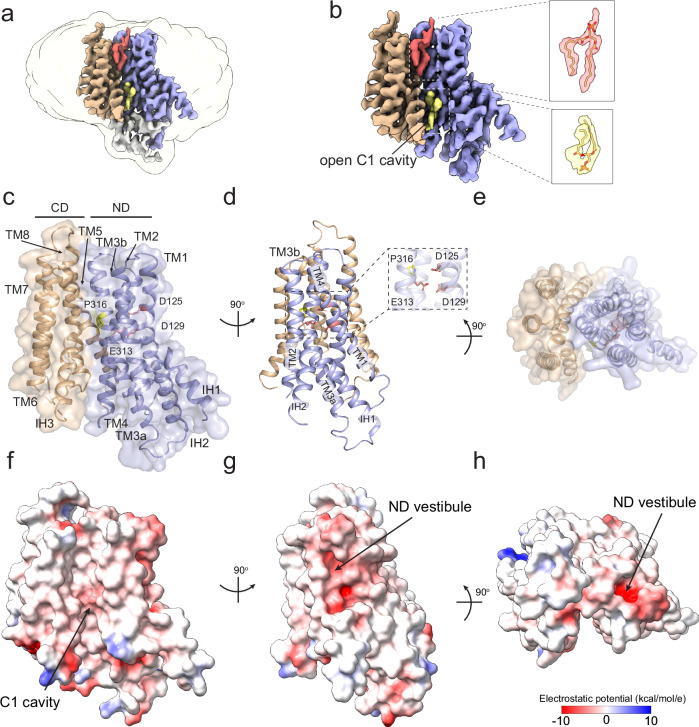
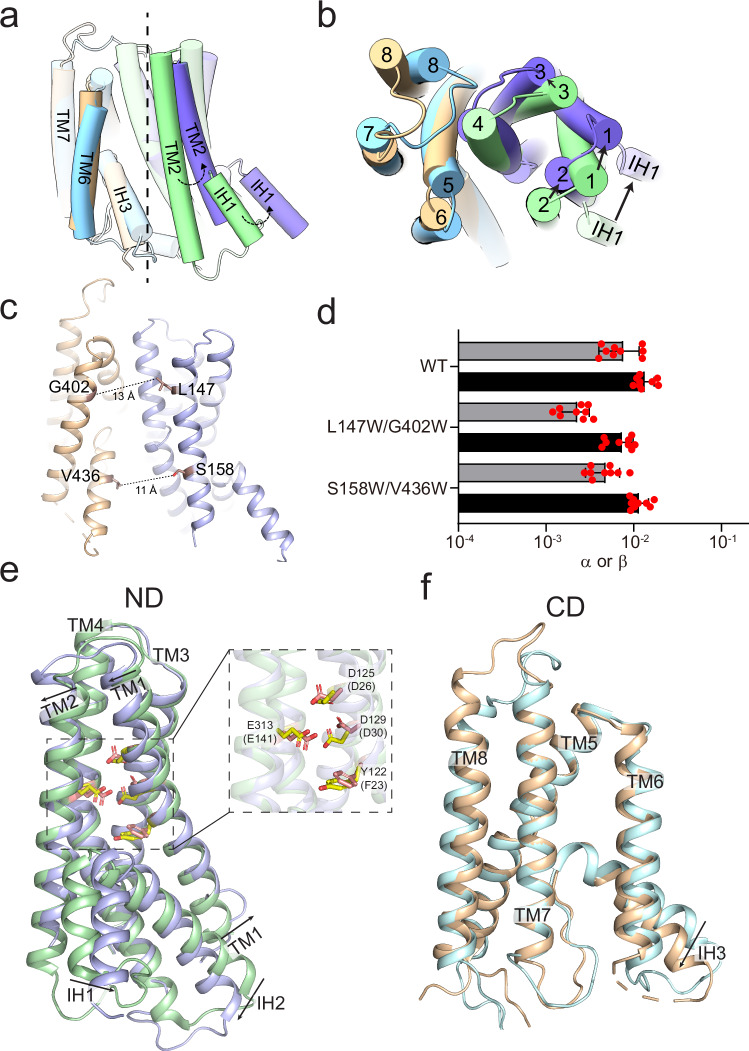
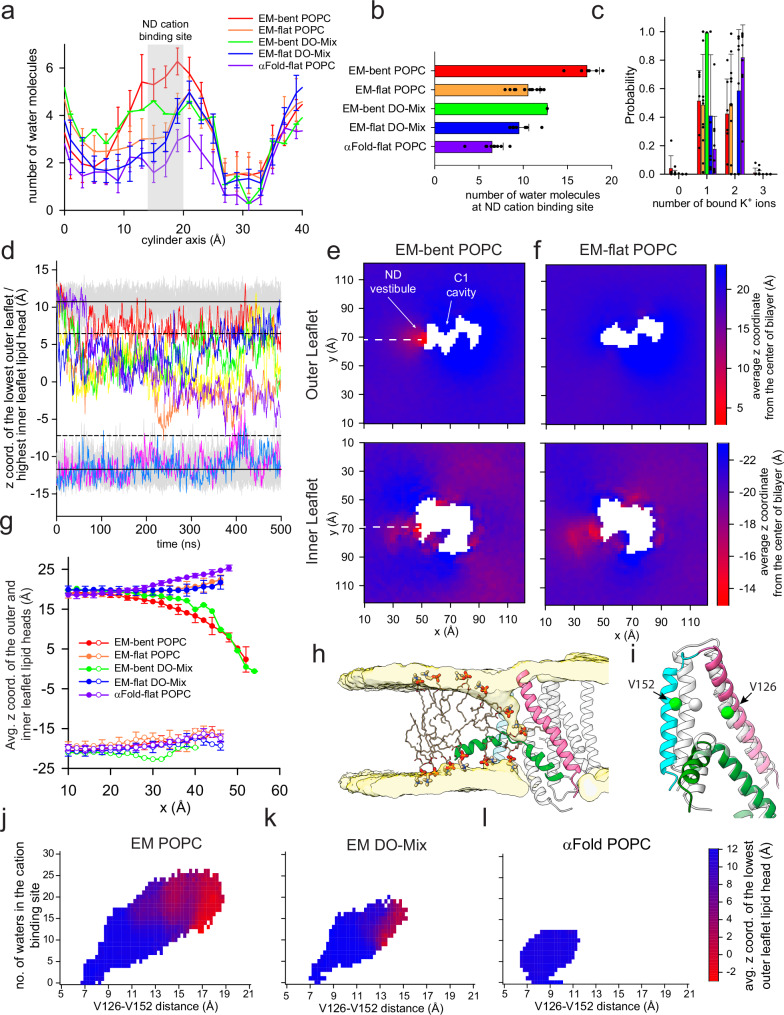
Phosphatidylserine externalization on the surface of dying cells is a key signal for their recognition and clearance by macrophages and is mediated by members of the X-Kell related (Xkr) protein family. Defective Xkr-mediated scrambling impairs clearance, leading to inflammation. It was proposed that activation of the Xkr4 apoptotic scramblase requires caspase cleavage, followed by dimerization and ligand binding. Here, using a combination of biochemical approaches we show that purified monomeric, full-length human Xkr4 (hXkr4) scrambles lipids. CryoEM imaging shows that hXkr4 adopts a novel conformation, where three conserved acidic residues create a negative electrostatic surface embedded in the membrane. Molecular dynamics simulations show this conformation induces membrane thinning, which could promote scrambling. Thinning is ablated or reduced in conditions where scrambling is abolished or reduced. Our work provides insights into the molecular mechanisms of hXkr4 scrambling and suggests the ability to thin membranes might be a general property of active scramblases.


Conflict of interest statement

Competing interests: The authors declare no competing interests.

Figures

Fig. 1
Fig. 1. Characterization of hXkr4 and CED-8 in proteoliposomes.
a Domain organization of Xkr4, Xkr8, Xkr9 and CED-8. b Representative traces of the dithionite induced fluorescence decay in the scrambling assay for protein free liposomes (cyan) and hXkr4 (red) reconstituted in 7:3 POPC:POPG mixed membranes. ce Forward (α) and reverse (β) scrambling rate constants of hXk4 reconstituted in 7:3 POPC:POPG mixed membranes doped with NBD-labeled PE (n = 19), PC (n = 9), or PS (n = 9) lipids (c), reconstituted in membranes formed from 7:3 POPC:POPG (n = 23), 7:3 DOPC:DOPG (n = 8), PO-mix (n = 10), DO-mix (n = 24), POPC (n = 10), Soybean (n = 10), PM mix (n = 3) (d), or with fixed 7 PC: 3 PG headgroup and acyl chain length C14 (n = 8), C16 (n = 9), C18 (n = 8), C22 (n = 9) (e). f Representative traces of the dithionite induced fluorescence decay in the scrambling assay for protein free liposomes (cyan), CED-8 (red), and ΔCED-8 (black) reconstituted in 7:3 POPC:POPG mixed membranes. g Forward (α) and reverse (β) scrambling rate constants of CED-8 and ΔCED-8 in liposomes formed from 7:3 POPC:POPG (n = 6 for CED-8 and n = 6 for ΔCED-8) or Soybean Polar lipids (n = 4 for CED-8 and n = 6 for ΔCED-8). Bars in panels (c, d, e, g) are averages for α (black) and β (gray) (N ≥ 3), error bars are S. Dev., and red circles are values from individual repeats whose values are reported in the Source Data Files. h, i Deconvoluted mass plot obtained from nMS analysis of hXkr4 from PM-mimicking liposomes (h) or from 2:1:1 DOPE:DOPC:DOPS (DO mix) liposomes (i). The relative lipid composition is given in the pie charts (insets) and in Supplementary Table 1.
Fig. 2
Fig. 2. Structure of hXkr4.
a, b CryoEM density of hXkr4 in LMNG-CHS detergent micelles. The ND repeat is colored in pale blue, the CD repeat in wheat. Associated lipid-like densities are shown in yellow (inner leaflet) and red (outer leaflet). Insets show close-up views of the two lipid-like densities in the C1 cavity. ce The structure of hXkr4 viewed from the plane of the membrane (c), from the side of the ND repeat (d), and from the extracellular solution (e). The protein is shown in ribbon representation with the ND repeat in pale blue, the CD repeat in wheat, the charged stairway residues (D125, D129, and E313 in pink) and P316 (in yellow) are shown in stick representation. The transparent surface representation of the protein is shown in (c) and (e). fh Electrostatic potential plotted on the surface of hXkr4 from the same views as in (ce).
Fig. 3
Fig. 3. Structural changes in Xkr4.
a, b The cryoEM structures of hXkr4 and hXkr8 (PDBID: 8XEJ), shown in cylindrical cartoon representations, are aligned on their respective CD domains (wheat for hXkr4 and cyan for hXkr8). The pseudo-symmetry axis (dashed vertical line, panel a) and angle of rotation of the ND of hXkr4 (pale blue) relative to the ND of hXkr8 (pale green) is viewed from the plane of the membrane (a) or from the extracellular solution (b). The C-terminal helix of hXkr8 is colored in pink. c The distance between the Cα atoms (maroon spheres) of L147 and S158 on TM2 and of G402W on TM6 and V436 on IH3 is shown (dashed lines). d Forward (α) and reverse (β) scrambling rate constants of WT (n = 9), L147W/G402W (n = 9), S158W/V436W (n = 9) hXkr4 reconstituted in DO-mix liposomes. Bars are averages for α (black) and β (gray) (N ≥ 3), error bars are S. Dev., and red circles are values from individual repeats whose values are reported in the Source Data Files. Alignment of the ND (e) and CD (f) repeats of hXkr4. Colors as in (a, b). Arrows denote direction of movement of the helices from hXkr8 to hXkr4. The charged residues in the ND of hXkr4 (hXkr8), D125 (D26), D129 (D30), E313 (E141), and Y122 (F23) are shown in stick representation and colored in yellow CPK (hXkr4) or pink CPK (hXkr8). Inset of (e) shows a close-up view of these residues.
Fig. 4
Fig. 4. Hydration, ion binding and membrane thinning by hXkr4.
a The average number of water molecules along the cylindrical axis along the ND vestibule (Fig. 4 Supplementary Fig. 1a) for trajectories of cryoEM hXkr4 where the membrane bends (EM-bent) or where it remains flat (EM-flat), in POPC lipids (EM-bent POPC, red, n = 6; EM-flat POPC, orange, n = 14), or in DO-Mix membranes (EM-bent DO-Mix, green, n = 1; EM-flat DO-Mix, blue, n = 9), and of αFold model hXkr4 in POPC (αFold-flat POPC, purple, n = 10). See Methods for details. The region of the cation site in the ND vestibule (near D125, D129, and E313, 16 Å<h < 20 Å) is colored in gray. b, c The average total number of water molecules in the ND cation site (b) and the probability distribution of the number of K+ ions in the ND cation site (c) for the same trajectory groups as in (a). Filled black circles in (b, c) represent values from individual trajectories. Error bars in (ac) are the St.Dev. of the values from individual trajectories. For EM-bent DO-Mix n = 1, as we observe membrane bending only in 1 trajectory, so no error is reported. d Time evolution of the z coordinate of the phosphorous atom in the lowest/highest outer/inner leaflet lipid headgroup of individual trajectories of EM-flat POPC (gray) and EM-bent POPC (colored). Solid and dotted lines represent the Avg. and Avg.+ or - 3xSt.Dev of the z coordinate for IL and OL, respectively. e, f Two-dimensional (2D) plot of the average z coordinate of the phosphorous atoms in the outer (top panel) and inner (bottom panel) leaflet lipid headgroups on the x-y plane of the simulation box, calculated from EM-bent POPC (e) or EM-flat POPC (f) trajectories. Individual pixels are colored from red to blue by the average z coordinate displacement. g Cross-section of the 2D plot calculated along the white dotted lines in (e, f) for the outer (filled circles) and inner (empty circles) leaflets. Data is Mean± St.Dev. n as in (a). h Representative snapshot from an EM-bent POPC trajectory. hXkr4 is shown in cartoon representation with TM1 (pink), TM2 (cyan), and IH1 (green), TM3-8 are in light gray. The average lipid head density of the outer and inner leaflets is shown in surface representation (light yellow). Representative lipid molecules are shown in stick, headgroup atoms in thicker sticks. i Superposition of the TM1, TM2, and IH1 from the cryoEM (light gray) and representative MD frame (colored as in h), where the Cα distances between V126 in TM1 and V152 in TM2, shown as spheres (green), are ~7.5 (cryoEM) and ~15 Å (MD). jl The average z coordinate of the phosphorous atom of the headgroups from the lowest outer leaflet lipid (colored from is plotted as a function of the V126-V152 Cα distance (x axis) and of the number of water molecules in the cation site in the ND vestibule (y axis) for trajectories for cryoEM hXkr4 in POPC (j) or DO-Mix membranes (k) or for αFold hXkr4 POPC (l).
Fig. 5
Fig. 5. Role of charged stairway residues and Ca2+ binding to hXkr4.
ag Probability distribution of the number of K+ ions in the ND cation site (a), distribution of water molecules in the ND repeat vestibule (b), total number of water molecules in the ND cation site (c), average z coordinate of the phosphorous atom of the lower/highest lipid headgroup from the outer/inner leaflet in MD trajectories of hXkr4 D125A bent (red, n = 2), D125A flat (orange, n = 8), D129A bent (green, n = 1), D129A flat (cyan, n = 9), E313A bent (blue, n = 1), or E313A flat (purple, n = 9) in POPC membranes (d). Data is mean (eg) the average z coordinate of the phosphorous atom of the headgroups from the lowest outer leaflet lipid (colored from is plotted as a function of the V126-V152 Cα distance (x axis) and of the number of water molecules in the cation site in the ND vestibule (y axis) for trajectories for D125A (e), D129A (f), and E313A (g). h Forward (α) and reverse (β) scrambling rate constants of WT (n = 15), D125N (n = 9), D129N (n = 9), and E313Q (n = 9) hXkr4 reconstituted in DO-Mix liposomes. Ik Quantification of Ca2+ or water molecules observed during simulation. Bars are averages for α (black) and β (gray) (N ≥ 3), error bars are S. Dev., and red circles are values from individual repeats whose values are reported in the Source Data Files. *-**** denote the statistical significance evaluated using a two sided Student’s t-test and comparing to the WT experiments that were carried out in side-by-side reconstitutions. The WT data points are included in Fig. 1d. p(αD125N) = 0.001, p(βD125N) = 0.003; p(αD129N) < 0.0001, p(βD129N) = 0.0001; p(αE313Q) < 0.0001, p(βE313Q) < 0.0001. ln Same plots as in (ag) but for simulations of hXkr4 in cryoEM conformation in POPC (n = 6 for bent, and n = 4 for flat) and DO-mix (n = 1 for bent and n = 9 for flat) membranes in the presence of Ca2+, and for hXkr4α in POPC membranes with Ca2+ (n = 10 for flat). o Forward (α) and reverse (β) scrambling rate constants of hXk4 reconstituted in DO-Mix liposomes in unbuffered Ca2+ (~10 µM) (n = 9), 2 mM EGTA ( < 10 nM Ca2+) (n = 9), and 0.5 mM Ca2+ (n = 10). Data in all panels is Mean± St.Dev. and red circles are values from individual repeats whose values are reported in the Source Data Files.

Update of

Similar articles

References

    1. Bevers, E. M. & Williamson, P. L. Getting to the Outer Leaflet: Physiology of Phosphatidylserine Exposure at the Plasma Membrane. Physiol. Rev.96, 605–645 (2016). - PubMed
    1. Sakuragi, T. & Nagata, S. Regulation of phospholipid distribution in the lipid bilayer by flippases and scramblases. Nat. Rev. Mol. Cell Biol. 24, 576–596 (2023). - PMC - PubMed
    1. Kobayashi, T. & Menon, A. K. Transbilayer lipid asymmetry. Curr. Biol.28, R386–R391 (2018). - PubMed
    1. Whitlock, J. M. & Hartzell, H. C. Anoctamins/TMEM16 Proteins: Chloride Channels Flirting with Lipids and Extracellular Vesicles. Annu Rev. Physiol.10, 119–143 (2017). - PMC - PubMed
    1. Singh, N. Apoptosis in health and disease and modulation of apoptosis for therapy: An overview. Indian J. Clin. Biochem22, 6–16 (2007). - PMC - PubMed

MeSH terms

Substances

LinkOut - more resources