. 2025 Aug 8;8(1):1187.
doi: 10.1038/s42003-025-08618-3.

Physical activity simultaneously improves working memory and ripple-spindle coupling

Affiliations

Physical activity simultaneously improves working memory and ripple-spindle coupling

Xinyun Che et al. Commun Biol. .

Abstract

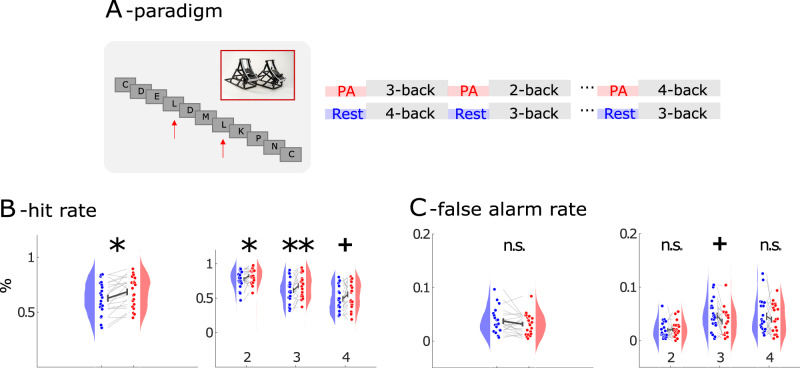
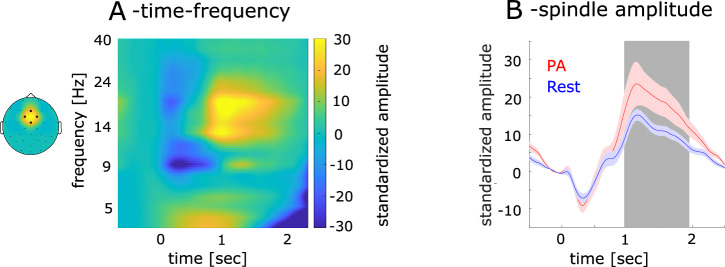
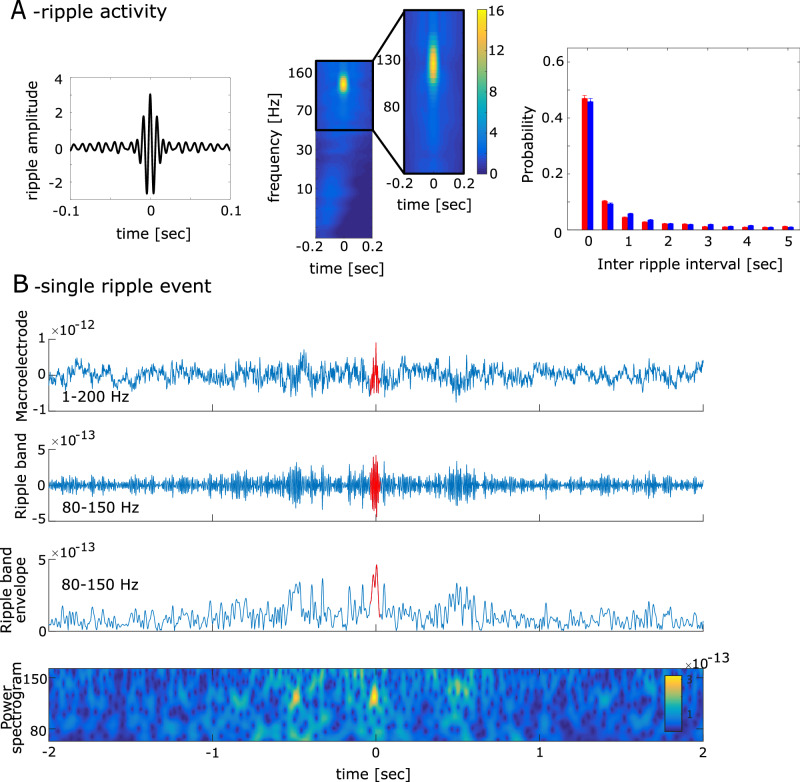
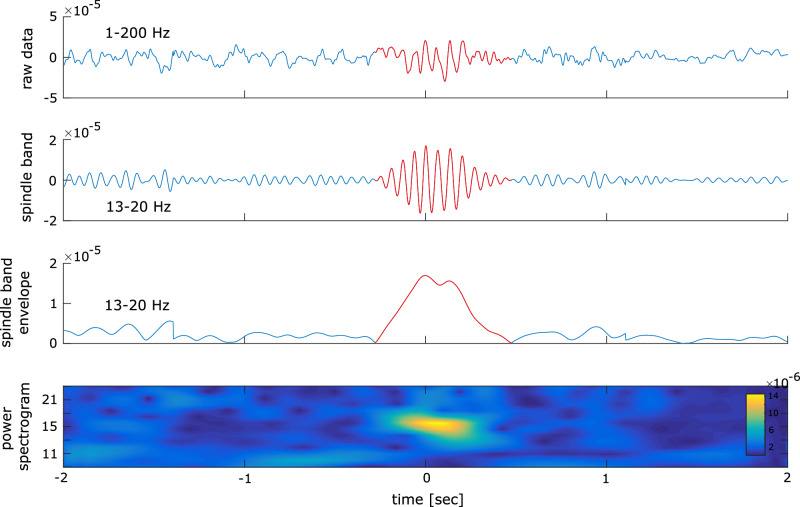
Ripples, representing the compressed reactivation of environmental information, provide a mechanism for retaining memory information in chronological order and are also crucial for working memory (WM) during wakefulness. Brief sessions of physical activity (PA) are proposed to boost WM. In concurrent EEG/MEG sessions, we investigated the role of PA in WM performance and high-frequency-ripple to wake spindle coupling. Ripples, identified in MEG sensors covering the medial temporal lobe (MTL) region, predicted individual WM performance. Ripples were locked to robust oscillatory patterns in the EEG defined spindle band. Wake spindle activity and ripples decrease during initial stimulus presentation and rebound after 1 sec. Behaviorally, PA enhanced WM performance. Neurophysiologically, PA scaled the ripple rate with the number of items to be kept in WM and strengthened the coupling between ripple events and wake spindle events. These findings reveal that PA modulates WM by coordinating ripple-spindle interaction.


Conflict of interest statement

Competing interests: The authors declare no competing interests.

Figures

Fig. 1
Fig. 1. Behavioral performance.
A Task design. Subjects were instructed to rest or use a pedal trainer before the N-back task. B (left): shows that hit rate increased across all conditions. (right): Hit rate across different N-back conditions. Error bars indicate the standard error of the mean. (n = 21; +: P < 0.05, *: P < 0.017, **: P < 0.003, Bonferroni-corrected). C (left): Individual false alarm rate. (right): False alarms across different N-back conditions. Red indicates PA and blue rest session. (n = 21; +: P < 0.05, n.s.: not statistically significant).
Fig. 2
Fig. 2. Frequency amplitude of EEG low frequency, standardized spindle and theta amplitude and ripples.
A EEG amplitudes modulation in frequencies 1–40 Hz as a function of time. B The amplitude modulation of the spindle band (14–18 Hz) across time for physical activity (red line) and rest (blue line). Shaded areas represent the standard error of the mean across subjects. The gray shading indicates the interval displaying significant differences between rest and PA. Time 0 represents stimulus onset.
Fig. 3
Fig. 3. high frequency ripple activation in MEG.
A (left): The grand-averaged signal of ripple activity. (middle): Time-frequency plot of ripple activity. (left): The probability of the interval time between two ripples across subjects. The error bars represent the standard deviation. The blue bar represents the ripple interval during the rest session, and the red bar represents the ripple interval during the PA session. B An example of ripples detected in our analysis. The upper line shows the broad band signal between 1 and 200 Hz. The second time series shows the same signal in the ripple band. The third time series shows the Hilbert transform of the ripple band activity. The last graphic shows the time frequency representation of the signal filtered between 80 and 150 Hz.
Fig. 4
Fig. 4. Ripple modulation.
A (upper): Topographical map of ripple likelihood across MEG sensors for rest (left) and PA (right). (lower): Correlation coefficients of ripple distributions between pairs of subjects. Higher correlations coefficients following PA indicate a more consistent spatial structure of ripples likelihood across subjects. Error bars indicate the standard error of the mean. (n = 210; ****P < 0.0001). B (left): Time series of ripple likelihood. Shaded areas represent the standard error of the mean across subjects. (middle): linear regression between individual memory capacity and ripple likelihood in segmented intervals. (right): The ripple likelihood time series from grand-averaged and different sessions, along with the corresponding t-values. (n = 21; *P < 0.05, n.s.: not statistically significant). C Ripple count across N-back conditions displayed individually. D Correlation coefficients for rest (blue) and PA (red) calculated between the ripple likelihood and the 2, 3, 4-back levels. (n = 21; *P < 0.05).
Fig. 5
Fig. 5. MEG-Ripple and EEG low-frequency coupling results.
A (left) Grand-averaged slow oscillations around the ripple peak compared to the shuffled peak. The dots at the top represent slow oscillation amplitude peaks and troughs from individual subjects. The red dots indicate amplitude peaks, while the pink dots indicate troughs. Error bars indicate the standard error of the mean. (right): The slow oscillations around the ripple peak from different sessions. The blue color represents the rest session, and the red color represents the PA session. B (left): Phase distribution of low frequency around the ripple peak. (right upper): The phase distribution from 14 to 16 Hz from different sessions and the dominant phase from individual subjects. B (right lower): Average dominant phases across sessions. (n = 21; *P < 0.05). C The ripple density during the ‘in-spindle’ and ‘out-of-spindle’ phases is plotted separately for the PA and rest sessions. Red denotes PA session data, while blue represents rest session data. Error bars indicate the standard error of the mean. (n = 21; **P < 0.01, n.s.: not statistically significant). D Ripple likelihood around the spindle onset. The time 0 represents the spindle onset.
Fig. 6
Fig. 6. spindle activation in EEG.
An example of spindle detected in our analysis. The upper line shows the broad band signal between 1 and 200 Hz. The second time series shows the same signal in the spindle band. The third time series shows the Hilbert transform of the spindle band activity. The last graphic shows the time frequency representation of the signal filtered between 13 and 20 Hz.

References

    1. Quelhas Martins, A., Kavussanu, M., Willoughby, A. & Ring, C. Moderate intensity exercise facilitates working memory. Psychol. Sport Exerc.14, 323–328 (2013).
    1. Abou Khalil, G., Doré-Mazars, K., Senot, P., Wang, D. P. & Legrand, A. Is it better to sit down, stand up or walk when performing memory and arithmetic activities?. Exp. Brain Res. 238, 2487–2496 (2020). - PubMed
    1. Suwabe, K. et al. Rapid stimulation of human dentate gyrus function with acute mild exercise. Proc. Natl Acad. Sci. USA115, 10487–10492 (2018). - PMC - PubMed
    1. Sibley, B. A. & Beilock, S. L. Exercise and Working Memory: An Individual Differences Investigation. J. Sport Exerc. Psychol.29, 783–791 (2007). - PubMed
    1. Audiffren, M. Acute Exercise and Psychological Functions: A Cognitive-Energetic Approach. in Exercise and Cognitive Function (eds. McMorris, T., Tomporowski, P. D. & Audiffren, M.) 1–39 (Wiley). 10.1002/9780470740668.ch1 (2009)