. 2025 Oct;31(10):3360-3371.
doi: 10.1038/s41591-025-03868-4. Epub 2025 Aug 8.

Early-life serological profiles and the development of natural protective humoral immunity to Streptococcus pyogenes in a high-burden setting

Affiliations

Early-life serological profiles and the development of natural protective humoral immunity to Streptococcus pyogenes in a high-burden setting

Alexander J Keeley et al. Nat Med. 2025 Oct.

Erratum in

Abstract

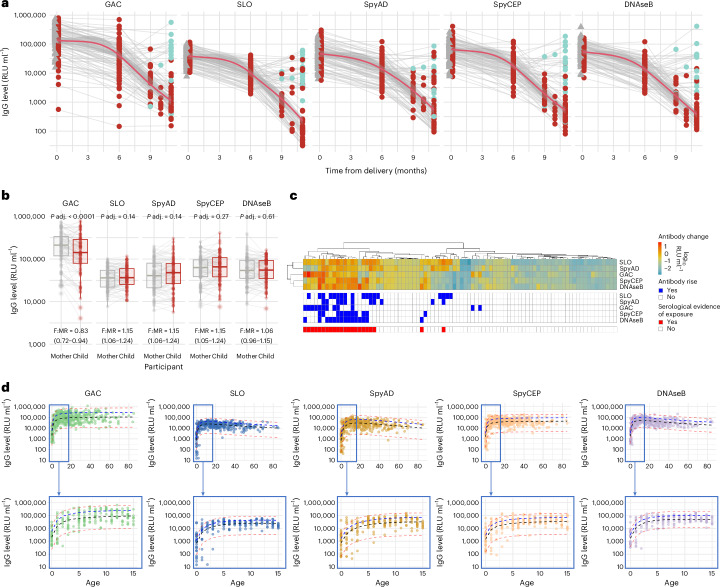
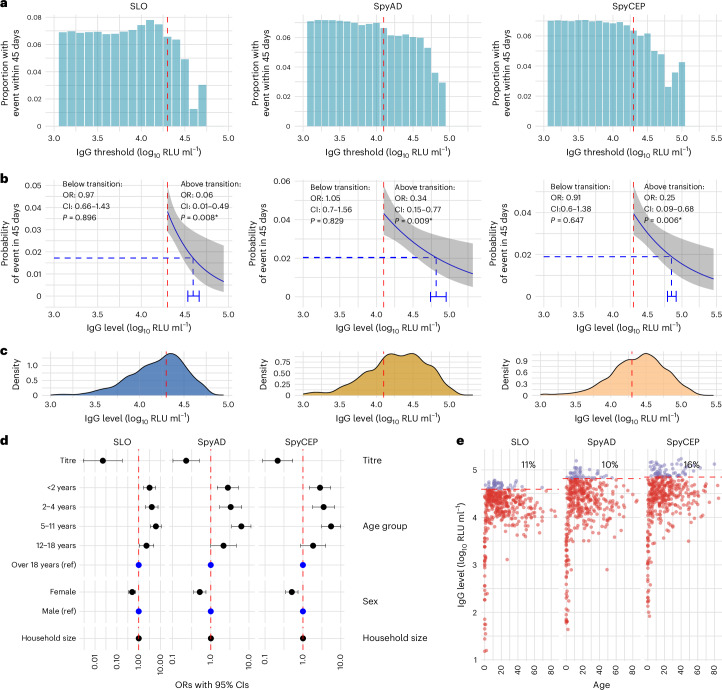
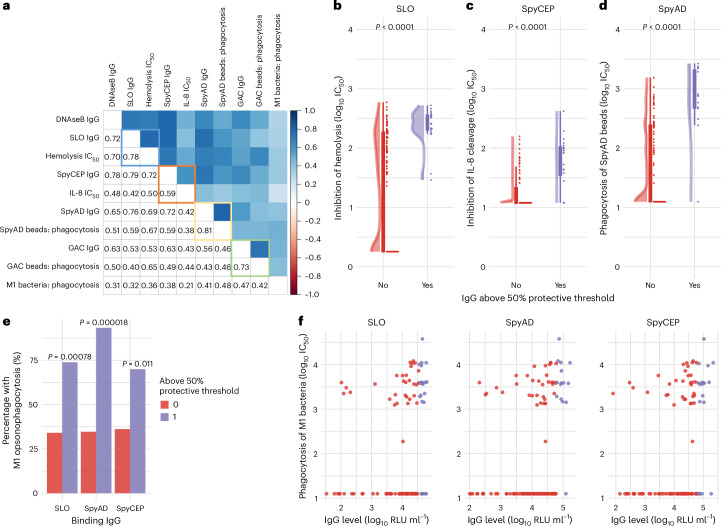
Streptococcus pyogenes leads to 500,000 deaths annually, many due to rheumatic heart disease in low-income settings. Limited understanding of natural protective immunity to S. pyogenes hinders vaccine development. Here we describe the evolution of serological profiles to conserved vaccine antigens and serotype-specific M proteins from birth and throughout the life course in The Gambia. As placentally transferred IgG waned after birth, serological evidence of new exposure was seen in 23% of infants during the first year of life. After culture-confirmed S. pyogenes events, the highest IgG increases occurred in children younger than 2 years of age after both pharyngeal and skin disease and asymptomatic carriage at both sites. Higher IgG levels against conserved vaccine antigens correlated with functional activity and were associated with protection from culture-confirmed events after adjustment for age and anti-M protein IgG levels. To our knowledge, our data provide the first evidence of protection associated with humoral immunity to conserved vaccine candidate antigens in humans.


Conflict of interest statement

Competing interests: A.J.K. received training in immunoassay development and delivery from the GSK Vaccines Institute for Global Health, an affiliate of GlaxoSmithKline (GSK). GSK had no role in overall study design, data analysis or data interpretation for this study. O.R., M.C., E.B., L.R., L.M., M.I. and D.G.M. are employees of the GSK Vaccines Institute for Global Health. A.B. and P.R.S. are inventors on a submitted patent related to Streptococcus pyogenes vaccines. The other authors declare no competing interests.

Figures

Fig. 1
Fig. 1. Study design and participants.
Cohort 1 consisted of 94 mother–child pairs from The Gambia recruited to a maternal vaccination trial with meningococcal conjugate vaccine. The newborn infants were followed through the first year of life. No microbiological sampling was performed on cohort 1. Cohort 2 comprised participants in the SpyCATS household cohort study. Red text indicates the sampling framework within both cohorts. In cohort 2, participants were swabbed from normal throat and skin to detect carriage. Participants could report disease symptoms (sore throat and skin sores) to the study team, prompting swabbing from the relevant site to detect disease events. Antibodies were measured from serum collected at study baseline and from DBSs at monthly visits and at any disease presentation. Purple boxes represent the number of samples included in each analysis. Breakdown of age groups and event types from cohort 2 is provided. Created in BioRender.com. m, months.
Fig. 2
Fig. 2. Early-life serological profiles and maternal antibody transfer.
a, Longitudinal IgG antibody profiles from mother–infant pairs (n = 94) over the first year of life. Gray triangles represent maternal delivery samples; dots represent infant samples. Red dots denote no observed titer increase between 6 months and subsequent visits; green dots indicate serological evidence of exposure (IgG rise to ≥2 antigens or >0.5 log10 RLU ml−1 to one antigen) between 6 months and subsequent visit. The red line shows the mean with 95% CI (LOESS method). b, Paired maternal and cord blood IgG levels at delivery (n = 94). Box plots show medians, IQR and 1.5× IQR whiskers; outliers are plotted individually. Two-sided paired Wilcoxon signed-rank tests were used, and P values were adjusted using FDR correction. F:MR IgG transfer ratios are shown. c, Antibody dynamics between 6 months and 9–11 months in infants with complete data (n = 86). Each column represents an individual participant. Top panel shows absolute change in log10 IgG levels between 6 months and 9–11 months. Hierarchical clustering using Euclidean distance and complete linkage was performed across individuals (columns) and antigens (rows). Middle panel shows binary changes (blue, increase; white, decrease). Bottom panel highlights infants with serological evidence of exposure. d, Cross-sectional IgG levels by age (n = 413, 0–85 years). Median (black), 80th (blue) and 2.5th/97th centile (red) lines were modeled using fractional polynomials. The bottom panel focuses on children aged 0–15 years. LOESS, locally weighted scatterplot smoothing; P adj., adjusted P value.
Fig. 3
Fig. 3. Blood IgG antibody profiles around culture-confirmed S. pyogenes events.
a, Individual IgG antibody profiles by age group around microbiologically confirmed S. pyogenes events, where pre-event titers and at least one subsequent titer were measured (n = 163 events). IgG was normalized to pre-event levels. Each dot represents an individual IgG level relative to the baseline titer. Gray lines connect individual participants’ IgG measured before, during and after events. Solid black lines represent the geometric mean log10-transformed IgG level changes across participants, grouped by temporal relationship to the event. Shaded areas around the lines represent 95% CIs. b, Forest plot showing the association between age group and event type with absolute IgG level changes around culture-conformed events (n = 150 events). Points represent estimated group differences, with horizontal bars indicating 95% CIs derived from mixed-effects linear regression models. c, Longitudinal blood IgG profiles in participants (n = 290) without microbiologically confirmed S. pyogenes events during the study period. IgG levels were normalized to individual participants’ baseline titers. Each dot represents an individual antibody titer relative to baseline, and gray lines connect titers measured over time. Dark blue lines represent geometric mean IgG level change from baseline by month, smoothed with the LOESS method. LOESS, locally weighted scatterplot smoothing; ref, reference.
Fig. 4
Fig. 4. Association between IgG levels to conserved vaccine antigens and protection from culture-confirmed S. pyogenes events.
a, The proportion of visits (n = 4,677) with IgG levels above each threshold associated with a culture-confirmed S. pyogenes event within 45 days. IgG levels were measured from n = 1,987 visits and assumed to remain constant between measurements. b, Piecewise logistic regression analysis with mixed effects to explore the relationship between IgG level and event within 45 days (n = 4,677 visits with 1,987 antibody measurements). Transition points in the relationship between IgG levels and event risk were identified from a and refined using AIC analysis. Piecewise logistic regression with titers above and below the transition point was performed. The blue line shows the fitted regression model, capturing the association between titer levels above the breakpoint and the probability of a S. pyogenes event within 45 days; gray shading represents the 95% CIs for model predictions. OR for each log10 IgG level change compared to the transition point, 95% CIs and P values from two-sided piecewise logistic regression models are displayed. No multiple testing correction was applied. The red vertical line indicates the transition point. Putative 50% protective thresholds were calculated using 10-fold cross-validation as the IgG level at which the predicted probability of an event with 45 days was 50% that of the predicted probability at the transition point. 50% thresholds are plotted with blue dashed lines along with 95% CIs (blue error bars) (*P < 0.05). c, Density plot showing the distribution of IgG measurements (n = 1,987) in relation to IgG level. The red line marks the transition identified in a. d, Forest plot to visualize the association between IgG level above the transition point for each conserved antigen (n = 4,677 visits with 1,987 antibody measurements) and any culture-confirmed event within 45 days. Points represent OR estimates from a mixed-effects logistic regression model adjusting for age, sex and household size. Horizontal bars represent 95% Wald CI. e, IgG level distribution by age in years at study baseline (n = 413), including the percentage of participants with IgG levels above (purple) the identified 50% protective threshold (red dashed line). ref, reference.
Fig. 5
Fig. 5. Exploring the role of type-specific anti-M protein antibodies in protective immunity.
a, Cross-sectional profiles of anti-M IgG z-scores at baseline in participants without events (n = 402), stratified by age in years. b, MFIs (adjusted for dilution) for each M peptide at baseline, showing relative IgG abundance across peptides. c, Absolute change in anti-M IgG z-scores around 130 culture-confirmed, M/emm typed S. pyogenes events. Paired measurements were categorized as homologous (n = 40), cluster-homologous (n = 202) or unrelated (n = 1,757) to the emm type of the event. Box plots show medians, IQRs and 1.5× IQR whiskers. Kruskal–Wallis and post hoc Dunn’s tests with Bonferroni correction were used for comparison (*P < 0.05 and **P < 0.01). d, Logistic mixed-effects models were used to assess the association between M/emm cluster-related anti-M IgG z-score and the odds of an event within 45 days. Anti-M IgG (z-scores) before, during and after culture-confirmed M/emm typed events in both cases (n = 378 measurements, 143 events, 103 participants) and household controls (n = 1,366 measurements from 293 participants) were identified against the emm cluster-related M peptide to the M/emm type of the event. The cluster-related IgG level was assigned hierarchically with the homologous titer included where available; otherwise, the emm cluster homologous titer was selected. OR for each z-score change, 95% CIs and P values from two-sided logistic regression models are displayed (*P < 0.05). e, Spearman’s correlation between z-score normalized anti-M IgG and conserved antigen IgG levels, based on 1,651 paired measurements. f, Tile plot showing predicted probabilities of an event within 45 days by anti-M IgG (z-score) and conserved antigen IgG above the transition point. Logistic mixed-effects models included both antibody types. g, Forest plot from fully adjusted logistic mixed-effects models (n = 1,652 samples from 307 individuals), showing ORs (points) and 95% Wald CIs (horizontal lines) for anti-M IgG and conserved antigen IgG above the transition point. Models were adjusted for age, sex and household size. NS, not significant; ref, reference.
Fig. 6
Fig. 6. Association between protective IgG profiles and in vitro inhibition of function and promotion of opsonophagocytosis.
a, Correlation coefficients (Spearman’s method) between binding IgG titers and functional immunoassays in n = 114 serum samples randomly selected across a broad range of binding IgG levels. Highlighted squares indicate the specific relationship between binding titers and the immunoassay that directly measures the function of the corresponding antigen. Blue square represents SLO, orange represents SpyCEP, yellow represents SpyAD and green represents GAC. bd, Relationship between binding IgG levels and functional activity in serum samples (n = 114): IgG binding levels to SLO and inhibition of SLO-mediated hemolysis (n =114) (b), IgG binding levels to SpyCEP and inhibition of SpyCEP-mediated IL-8 cleavage (n = 114) (c) and IgG binding levels to SpyAD and promotion of phagocytosis of SpyAD-coated beads by THP-1 cells (n = 114) (d). Box plots show the IQR (box) and 1.5× IQR whiskers. Points beyond whiskers represent outliers. IC50 values between those above and those below 50% protective thresholds were compared with two-sided Wilcoxon tests. e, Proportion of participants with titers above and below 50% protective thresholds with any detectable opsonophagocytosis of M1 bacteria. Proportions between groups were compared with a two-sided Fisherʼs exact test. f, Relationship between IgG binding titers to SLO, SpyAD, SpyCEP and opsonophagocytosis of M1 bacteria by THP-1 cells. Binding IgG level above (purple) and below (red) the 50% protective threshold is demonstrated.
Extended Data Fig. 1
Extended Data Fig. 1. Blood IgG antibody profiles around culture-confirmed S. pyogenes events.
a) Blood IgG antibody levels around microbiologically confirmed events. IgG levels from paired samples before and after a microbiologically confirmed event in the SpyCATS study (n = 150) were measured. IgG levels were compared using a paired Wilcoxon signed-rank test. Median IgG level is represented by centre line. P-values were adjusted for multiple testing using the false discovery rate (FDR) correction. b) Absolute Blood IgG increases around culture confirmed events by event type. P values are derived from Kruskall-Wallis tests to compare absolute IgG increases between multiple event types. No significant differences between groups were observed. Box plots show medians, IQR, 1.5×IQR whiskers and outliers. c) Individual IgG antibody profiles by age group around microbiologically confirmed S. pyogenes events, where pre-event IgG levels and at least one subsequent IgG level were measured (n = 163 events). IgG was normalized to pre-event levels. Each dot represents an individual IgG level relative to the baseline level. Grey lines connect individual participants’ IgG measured before, during and after events. Solid black lines represent the mean log10 transformed IgG level changes across participants, grouped by temporal relationship to the event. Shaded areas around the lines represent 95% confidence intervals calculated using the mean and standard error of the log-transformed IgG levels. d) Association between baseline (pre-event) IgG level and absolute increase in IgG level between pre and post event (n = 150 events). Pearson’s correlation coefficient (r) was calculated for each antige, using a two-sided test without correction for multiple comparisons.
Extended Data Fig. 2
Extended Data Fig. 2. Association between IgG levels to conserved antigens and protection from culture confirmed S. pyogenes events.
(a)The proportion of visits (n = 4677) with IgG levels above each threshold with a culture-confirmed S. pyogenes event within 45 days. IgG levels were measured from n = 1,987 visits and assumed to remain constant between measurement. (b) Logistic regression analysis with mixed effects to explore the relationship between IgG level and event within 45 days. The blue line shows the fitted regression model grey shading represents the 95% confidence intervals for model predictions. Odds ratios per log10 IgG level increase, 95% confidence intervals, and p-values for the logistic regression model are displayed.
Extended Data Fig. 3
Extended Data Fig. 3. Exploring synergistic effects of anti-SLO, -SpyAD and -SpyCEP IgG with protection from culture confirmed events.
(a) IgG levels (above the transition point of 4.3 log10 RLU ml−1 for SLO, 4.1 log10 RLU ml−1 for SpyAD and 4.3 log10 RLU ml−1 for SpyCEP) were included in all possible combinations with and without interaction terms and including covariates known to alter risk of S. pyogenes events: age group, sex and household size. AIC value for each model is plotted +− 2 represented by dotted lines. This allowed the selection of the model including IgG levels to SLO, SpyAD and SpyCEP without interaction terms (in bold text) to be used to explore synergistic effects between antigens. (b) Forest plot to visualise the association between IgG level above transition point for each conserved antigen and any culture-confirmed event within 45 days (n = 4677 visits with 1987 antibody measurements). Odds ratios (points) were calculated from a mixed effects logistic regression model adjusting for factors known to alter risk of S. pyogenes events: age, sex and household size. Horizontal bars represent 95% Wald confidence intervals. AIC = Akaike information criterion.
Extended Data Fig. 4
Extended Data Fig. 4. Specificity of multiplex assays to measure anti-M IgG.
(a) Specificity of the 14-plex assay to measure IgG to M/emm cluster representative M peptides. (b) Specificity of 6-plex assay to measure IgG to E3 M/emm cluster M peptides. Positive material consisting of intravenous immunoglobulin supplemented with pooled human serum was incubated with M-peptide inhibitors at a concentration of 2 µg/mL, prior to proceeding with a standard 14-plex, or 6-plex, assay to measure IgG to M/emm cluster representative M peptides. Percentage MFI inhibition in relation to the MFI of uninhibited material was calculated as ((MFI Control − MFI Inhibited sample)/MFI control) × 100. Yellow circles represent the magnitude of the MFI of the inhibited signal for each antigen (as a surrogate marker of overall concentration of each antibody in immunoglobulin supplemented with pooled human serum). MFI = Median fluorescent intensity. Numbers in each cell is the percentage inhibition. Red boxes indicate homologous inhibition.
Extended Data Fig. 5
Extended Data Fig. 5. Sensitivity analysis exploring the role of type specific anti-M protein antibodies in protective immunity.
(a) Absolute change in anti-M IgG Z-scores around 130 culture-confirmed, M/emm-typed S. pyogenes events. Only IgG measurements to M peptides with >45% homologous inhibition in inhibition assays (M1, M4, M44, M75, M89, M25, M87) were included. Paired measurements were categorised as homologous (n = 15), cluster-homologous (n = 104), or unrelated (n = 605) to the M/emm type of the event. Box plots show medians, IQRs, and 1.5×IQR whiskers. Comparisons were made using the Kruskal–Wallis test followed by Dunn’s test with Bonferroni correction (P < 0.05). (b) Logistic mixed effects models were used to assess the association between M/emm cluster-related anti-M IgG Z-score and the odds of an event within 45 days. Anti-M IgG (Z scores) before, during and after culture-confirmed M/emm-typed events in both cases (n = 247 measurements, 92 events, 74 participants) and controls (n = 791 measurements, 246 participants). Cluster-related titres were hierarchically assigned: homologous if available, otherwise cluster homologous. (c) Spearman’s correlation between anti-M IgG Z-scores and conserved antigen IgG levels from 969 paired measurements. (d) Forest plot from fully adjusted mixed effects logistic regression models including anti-M IgG (Z-score), conserved antigen IgG (above transition point), age group, sex, and household size. 969 measurements from 859 timepoints and 263 individuals were included. Points represent odds ratios and horizontal bars show 95% Wald confidence intervals. OR = Odds ratio; CI = confidence interval; RLU = Relative Luminex Unit.

References

    1. Carapetis, J. R., Steer, A. C., Mulholland, E. K. & Weber, M. The global burden of group A streptococcal diseases. Lancet Infect. Dis.5, 685–694 (2005). - PubMed
    1. Watkins, D. A. et al. Global, regional, and national burden of rheumatic heart disease, 1990–2015. N. Engl. J. Med.377, 713–722 (2017). - PubMed
    1. Walkinshaw, D. R. et al. The Streptococcus pyogenes vaccine landscape. npj Vaccines8, 16 (2023). - PMC - PubMed
    1. Vekemans, J. et al. The path to Group A Streptococcus vaccines: World Health Organization research and development technology roadmap and preferred product characteristics. Clin. Infect. Dis.69, 877–883 (2019). - PMC - PubMed
    1. WHO Preferred Product Characteristics for Group A Streptococcus Vaccines (World Health Organization, 2018); https://apps.who.int/iris/handle/10665/279142

MeSH terms