

Epidemiology of fatal and nonfatal community firearm violence in New York City, 2019-2023
- PMID: 40781646
- PMCID: PMC12333219
- DOI: 10.1186/s40621-025-00590-0
Epidemiology of fatal and nonfatal community firearm violence in New York City, 2019-2023
Abstract
Background: Endemic levels of community firearm violence in United States cities disproportionately burden certain sociodemographic groups. Nonfatal injuries are an understudied aspect of firearm violence. Police data in a large and heterogenous place like New York City (NYC) provide the unique opportunity to use a single data source to measure fatal and nonfatal community firearm violence.
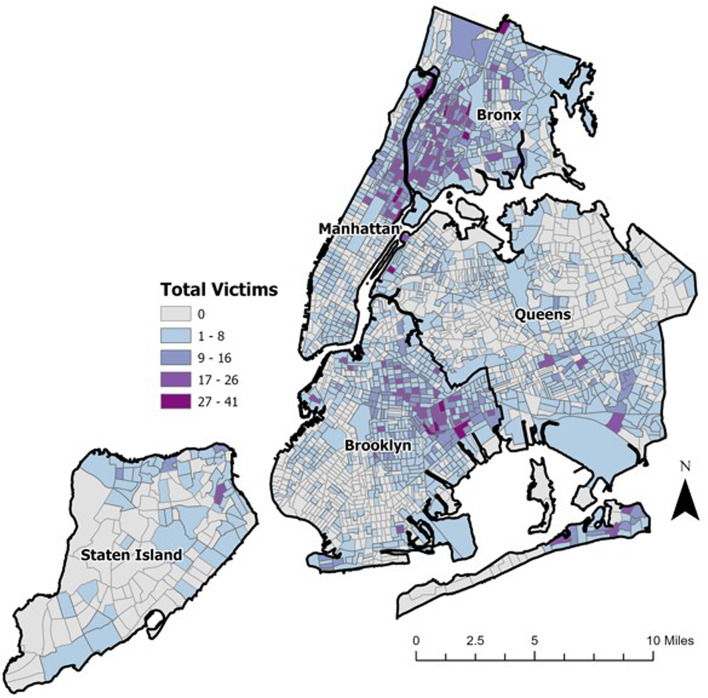
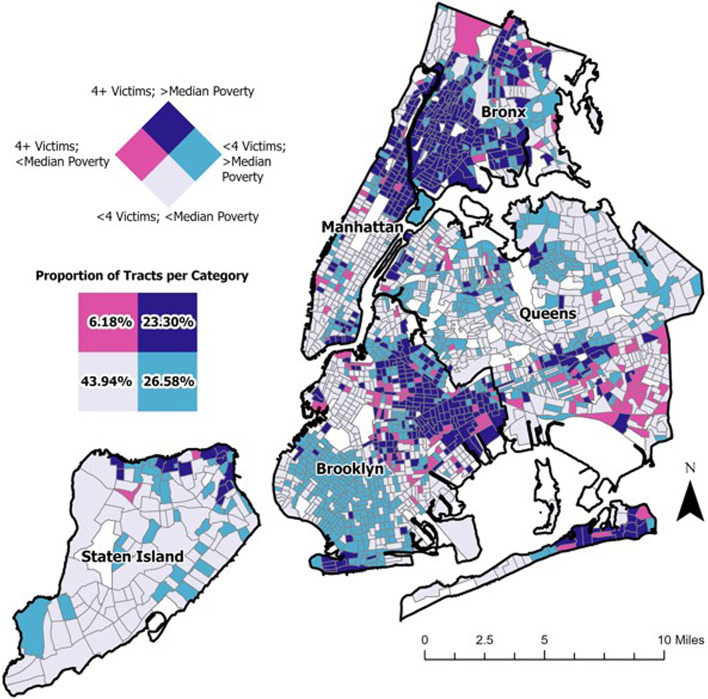
Methods: The study analyzed epidemiologic trends in fatal and nonfatal community firearm violence using the publicly available New York Police Department (NYPD) Shooting Incident Dataset from 2019 to 2023. The analyses tabulated shooting victims by sociodemographic variables (age group, race and ethnicity, and sex) and case fatality rates, mapped shootings by census tract, and described social determinants of health (SDOH)-poverty, educational attainment, unemployment-in the census tracts where shootings occurred.
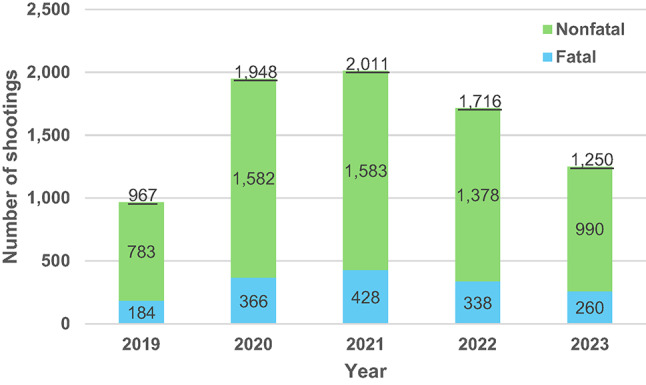
Results: From 2019 to 2023, the annual average number of shooting victims in NYC was 1,578. Shootings doubled from 2019 to 2020 though trended downward from 2021 to 2022 to 2023. Four out of five shootings were nonfatal. Males, people ages 18-24, and non-Hispanic Black people in NYC experienced the greatest proportion of shootings. Shootings coincided with census tracts also experiencing above median percentages of adverse SDOH (i.e., highest levels of unemployment, poverty, and low educational attainment).
Discussion: Nonfatal injuries are an important component of community firearm violence to monitor. The findings identify inequities in community firearm violence by sex, age group, and race and ethnicity in NYC. One contributor to racial inequities in violence is the impact of place-based SDOH in certain NYC neighborhoods.
Conclusions: This study leverages NYPD data to estimate the full magnitude of violence by tracking nonfatal in addition to fatal injuries. The study emphasizes the need for researchers to go beyond individual demography and better understand the place-based social determinants of firearm violence.
Keywords: Community firearm violence; Epidemiology; GIS; Mapping; Social determinants of health.
© 2025. The Author(s).
Conflict of interest statement
Declarations. Ethics approval and consent to participate: This study was reviewed and determined to be not human subjects research by the Johns Hopkins Bloomberg School of Public Health Institutional Review Board. The approval form is available upon request. All methods were performed in accordance with the ethical standards as laid down in the Declaration of Helsinki and its later amendments or comparable ethical standards. Consent for publication: Not applicable, although see ethical approval and consent to participate above. Competing interests: The authors declare no competing interests.
Figures


Similar articles
-
Surveillance for Violent Deaths - National Violent Death Reporting System, 48 States, the District of Columbia, and Puerto Rico, 2020.MMWR Surveill Summ. 2023 May 26;72(5):1-38. doi: 10.15585/mmwr.ss7205a1. MMWR Surveill Summ. 2023. PMID: 37220104 Free PMC article.
-
Surveillance for Violent Deaths - National Violent Death Reporting System, 50 States, the District of Columbia, and Puerto Rico, 2022.MMWR Surveill Summ. 2025 Jun 12;74(5):1-42. doi: 10.15585/mmwr.ss7405a1. MMWR Surveill Summ. 2025. PMID: 40493548 Free PMC article.
-
Social Vulnerability and Firearm Violence: Geospatial Analysis of 5 US Cities.J Am Coll Surg. 2023 Dec 1;237(6):845-854. doi: 10.1097/XCS.0000000000000845. Epub 2023 Sep 13. J Am Coll Surg. 2023. PMID: 37966089
-
A scoping review of empirical research on firearms and firearm violence among sexual and gender minority populations in the United States.Ann Behav Med. 2025 Jan 4;59(1):kaae094. doi: 10.1093/abm/kaae094. Ann Behav Med. 2025. PMID: 39774605
-
Falls prevention interventions for community-dwelling older adults: systematic review and meta-analysis of benefits, harms, and patient values and preferences.Syst Rev. 2024 Nov 26;13(1):289. doi: 10.1186/s13643-024-02681-3. Syst Rev. 2024. PMID: 39593159 Free PMC article.
References
-
- Office of the Surgeon General (OSG). Firearm Violence: A Public Health Crisis in America: The U.S. Surgeon General’s Advisory [Internet]. Washington (DC): US Department of Health and Human Services (US); 2024. About This Advisory. Available from: https://www.ncbi.nlm.nih.gov/books/NBK605163/ - PubMed
-
- Davis A, Kim R, Crifasi C. A Year in Review: 2021 Gun Deaths in the U.S.; 2021. Accessed June 17, 2023. https://publichealth.jhu.edu/sites/default/files/2023-06/2023-june-cgvs-...
-
- Villarreal S, Kim R, Wagner E, Somayaji N, Davis A, Crifasi C. Gun Violence in the United States 2022: Examining the Burden Among Children and Teens. Johns Hopkins Center for Gun Violence Solutions. Johns Hopkins Bloomberg School of Public Health; 2024. Accessed October 28, 2024. https://publichealth.jhu.edu/sites/default/files/2024-09/2022-cgvs-gun-v...
-
- Centers for Disease Control and Prevention National Center for Health Statistics. National Vital Statistics, System. Mortality 2018–2023 on CDC WONDER Online Database, released in 2024. Accessed February 19, 2025. Data are from the Multiple Cause of Death Files, 2018–2023, as compiled from data provided by the 57 vital statistics jurisdictions through the Vital Statistics Cooperative Program. Accessed at http://wonder.cdc.gov/ucd-icd10-expanded.html
LinkOut - more resources
Full Text Sources
