

Integrated phenotypic analysis, predictive modeling, and identification of novel trait-associated loci in a diverse Theobroma cacao collection
- PMID: 40781653
- PMCID: PMC12335022
- DOI: 10.1186/s12870-025-07128-y
Integrated phenotypic analysis, predictive modeling, and identification of novel trait-associated loci in a diverse Theobroma cacao collection
Abstract
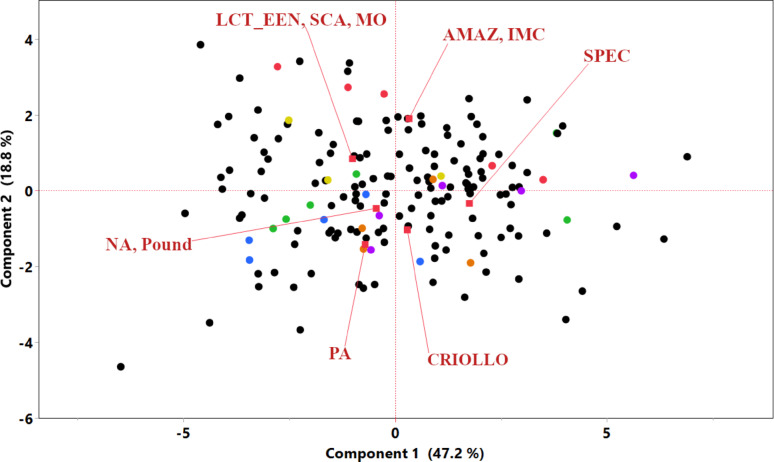
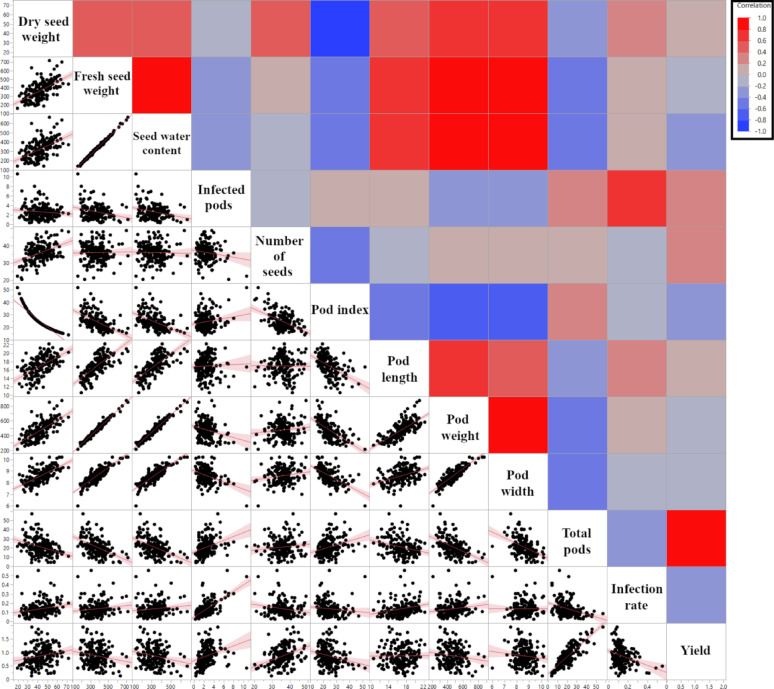
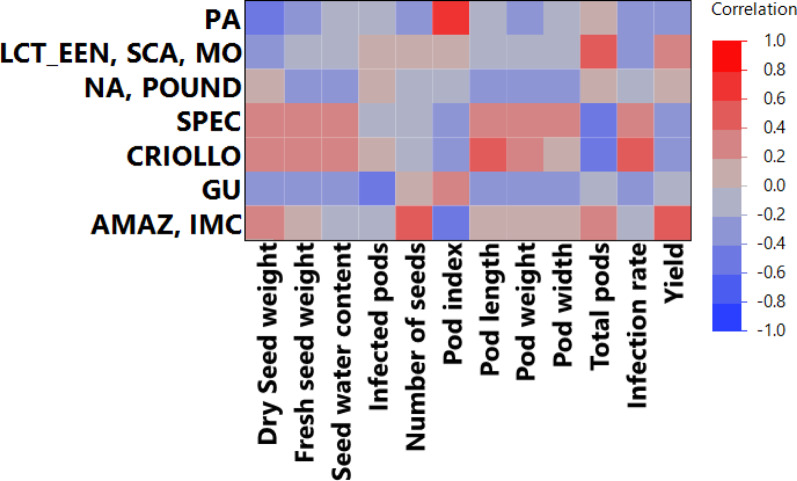
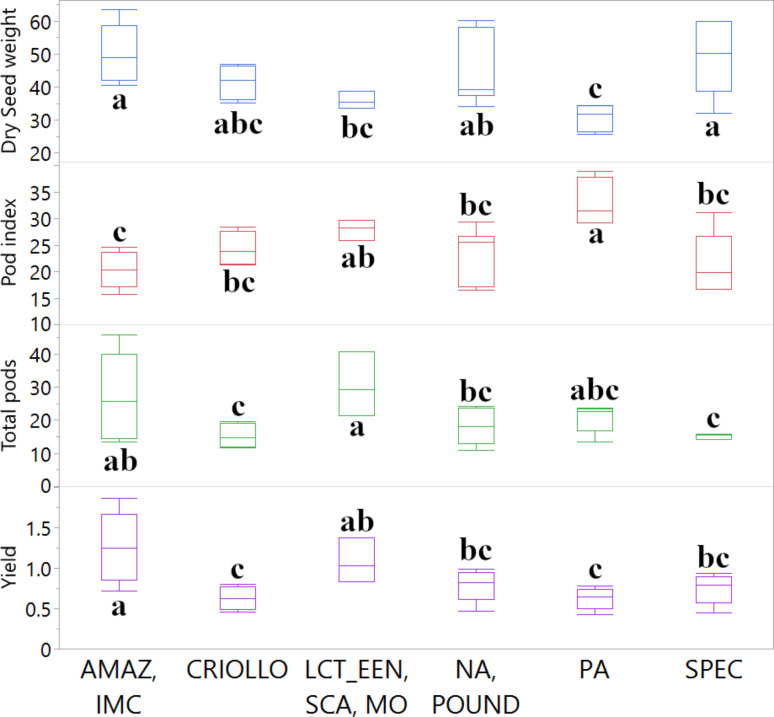
Background: Cacao (Theobroma cacao L.) breeding and improvement rely on understanding germplasm diversity and trait architecture. This study characterized a cacao collection (173 accessions) evaluated in Puerto Rico, examining phenotypic diversity, trait interrelationships, and performing comparative analyses with published Trinidad and Colombia datasets. We also developed machine learning (ML) models for yield prediction and identified yield-associated SNP markers.
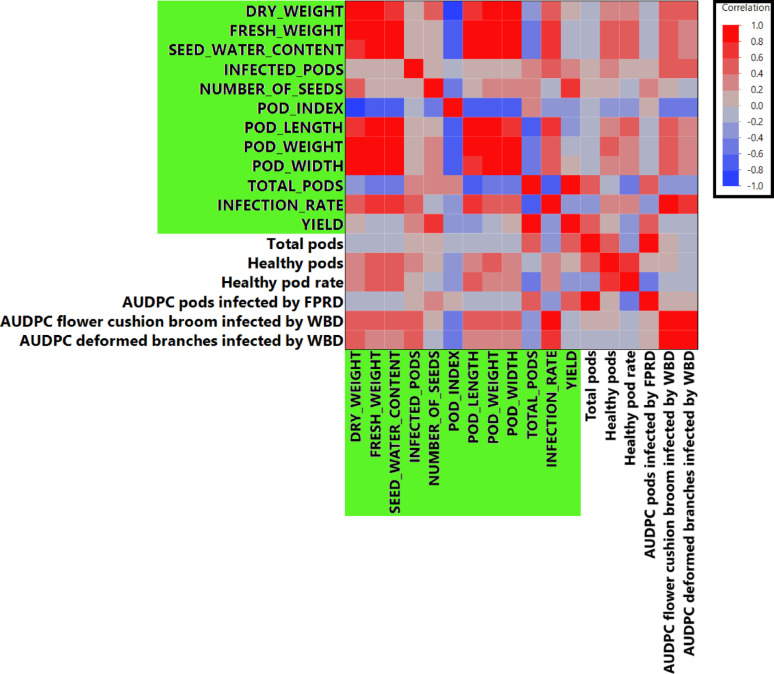
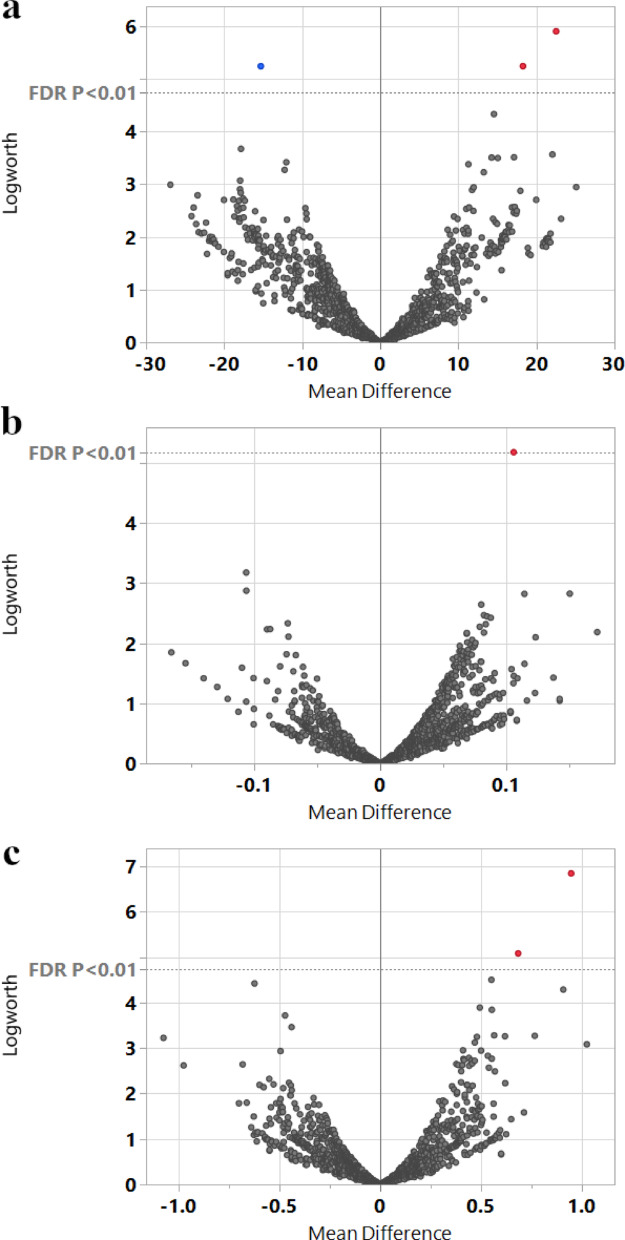
Results: The cacao collection showed significant phenotypic variation and strong intra-collection trait correlations. Comparative analyses revealed conserved trait responses across environments, notably linking susceptibility to black pod rot in Puerto Rico with Witches' Broom Disease in Colombia, suggesting a broad-spectrum disease response mechanism. Machine learning models effectively modeled yield, quantifying a hierarchy of predictor importance, with 'Total pods', 'Infection rate', and 'Pod weight' being the most influential. Integrating existing SNP data for 28 common accessions, multiple SNPs were identified as significantly associated with key horticultural traits, including 'Total pods', 'Infection rate', and 'Yield' (FDR < 0.01). Notably, a single genetic marker on chromosome 5 (TcSNP475), located within a putative zinc finger stress-associated protein gene (Tc05_t008610), was associated with both 'Total pods' and 'Yield', representing a prime target for marker-assisted selection.
Conclusions: This research provides a detailed characterization of a wide germplasm collection, robust yield predictors, and a suite of novel trait-linked genetic markers, offering valuable resources for cacao breeding. These integrated findings will provide a solid foundation for targeted breeding strategies and deeper molecular investigations into the mechanisms underpinning yield and stress resilience in this vital global crop.
© 2025. This is a U.S. Government work and not under copyright protection in the US; foreign copyright protection may apply.
Conflict of interest statement
Declarations. Ethics approval and consent to participate: Not applicable. Consent for publication: Not applicable. Competing interests: The authors declare no competing interests.
Figures
Similar articles
-
Machine learning-driven GWAS uncovers novel candidate genes for resistance to frosty pod rot and witches' broom disease in cacao.Plant Genome. 2025 Sep;18(3):e70069. doi: 10.1002/tpg2.70069. Plant Genome. 2025. PMID: 40640111 Free PMC article.
-
TEA5K: a high-resolution and liquid-phase multiple-SNP array for molecular breeding in tea plant.J Nanobiotechnology. 2025 Jul 2;23(1):481. doi: 10.1186/s12951-025-03533-5. J Nanobiotechnology. 2025. PMID: 40605004 Free PMC article.
-
Candidate gene identification and marker development for seed coat peeling rate in peanut (Arachis Hypogaea L.).BMC Plant Biol. 2025 Jul 25;25(1):959. doi: 10.1186/s12870-025-07007-6. BMC Plant Biol. 2025. PMID: 40713477 Free PMC article.
-
Breeding perspectives on tackling trait genome-to-phenome (G2P) dimensionality using ensemble-based genomic prediction.Theor Appl Genet. 2025 Jul 4;138(7):172. doi: 10.1007/s00122-025-04960-6. Theor Appl Genet. 2025. PMID: 40613890 Free PMC article. Review.
-
The National Plant Germplasm System cotton collection-a review of germplasm resources, phenotypic characterization, and genomic variation.Theor Appl Genet. 2025 Aug 20;138(9):220. doi: 10.1007/s00122-025-05009-4. Theor Appl Genet. 2025. PMID: 40833628 Review.
References
-
- Kongor JE, Owusu M, Oduro-Yeboah C. Cocoa production in the 2020s: challenges and solutions. CABI Agric Biosci. 2024;5:102.
-
- Argout X, Salse J, Aury J-M, Guiltinan MJ, Droc G, Gouzy J, et al. The genome of Theobroma cacao. Nat Genet. 2011;43:101–8. - PubMed
-
- Aikpokpodion P. Phenology of flowering in Cacao (Theobroma cacao) and its related species in Nigeria. Afr J Agric Res. 2012;7:3395–402.
-
- Falque M, Lesdalons C, Eskes AB. Comparison of two Cacao (Theobroma Cacao L.) clones for the effect of pollination intensity on fruit set and seed content. Sex Plant Reprod. 1996;9:221–7.
-
- Snoeck D, Koko L, Joffre J, Bastide P, Jagoret P. Cacao nutrition and fertilization. In: Lichtfouse E, editor. Sustainable agriculture reviews: volume 19. Cham: Springer International Publishing; 2016. pp. 155–202.
MeSH terms
Grants and funding
LinkOut - more resources
Full Text Sources
